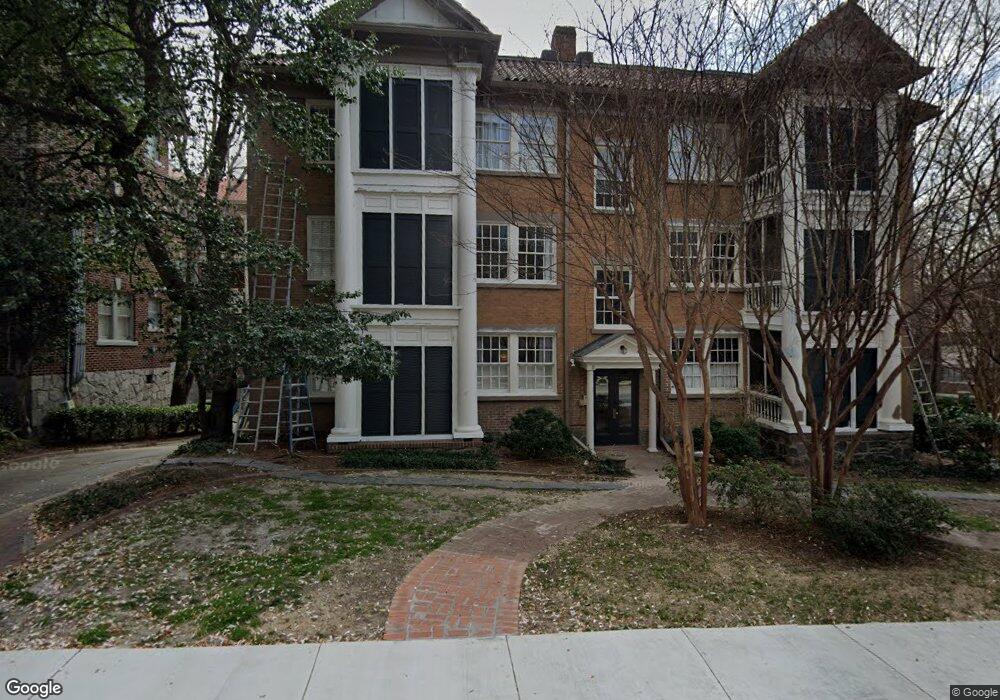
8 Collier Rd NW Atlanta, GA 30309
Ardmore NeighborhoodEstimated Value: $234,000 - $273,000
2
Beds
1
Bath
810
Sq Ft
$316/Sq Ft
Est. Value
About This Home
This home is located at 8 Collier Rd NW, Atlanta, GA 30309 and is currently estimated at $256,253, approximately $316 per square foot. 8 Collier Rd NW is a home located in Fulton County with nearby schools including Rivers Elementary School, Sutton Middle School, and North Atlanta High School.
Ownership History
Date
Name
Owned For
Owner Type
Purchase Details
Closed on
Aug 28, 2024
Sold by
Hopson Sarah
Bought by
Prince Kelly R
Current Estimated Value
Home Financials for this Owner
Home Financials are based on the most recent Mortgage that was taken out on this home.
Original Mortgage
$1,500
Outstanding Balance
$1,239
Interest Rate
6.73%
Mortgage Type
New Conventional
Estimated Equity
$255,014
Purchase Details
Closed on
Oct 24, 2018
Sold by
Mann Kimberly E
Bought by
Hopson Sara
Home Financials for this Owner
Home Financials are based on the most recent Mortgage that was taken out on this home.
Original Mortgage
$207,100
Interest Rate
4.7%
Mortgage Type
New Conventional
Purchase Details
Closed on
May 14, 2015
Sold by
Perticone Pamela D
Bought by
Mann Kimberly E
Home Financials for this Owner
Home Financials are based on the most recent Mortgage that was taken out on this home.
Original Mortgage
$115,200
Interest Rate
3.79%
Mortgage Type
New Conventional
Create a Home Valuation Report for This Property
The Home Valuation Report is an in-depth analysis detailing your home's value as well as a comparison with similar homes in the area
Home Values in the Area
Average Home Value in this Area
Purchase History
| Date | Buyer | Sale Price | Title Company |
|---|---|---|---|
| Prince Kelly R | $267,500 | -- | |
| Hopson Sara | $218,000 | -- | |
| Mann Kimberly E | $144,000 | -- |
Source: Public Records
Mortgage History
| Date | Status | Borrower | Loan Amount |
|---|---|---|---|
| Open | Prince Kelly R | $1,500 | |
| Open | Prince Kelly R | $187,250 | |
| Previous Owner | Hopson Sara | $207,100 | |
| Previous Owner | Mann Kimberly E | $115,200 |
Source: Public Records
Tax History Compared to Growth
Tax History
| Year | Tax Paid | Tax Assessment Tax Assessment Total Assessment is a certain percentage of the fair market value that is determined by local assessors to be the total taxable value of land and additions on the property. | Land | Improvement |
|---|---|---|---|---|
| 2025 | $1,394 | $99,080 | $11,960 | $87,120 |
| 2023 | $3,801 | $91,800 | $11,720 | $80,080 |
| 2022 | $1,687 | $88,440 | $12,000 | $76,440 |
| 2021 | $1,631 | $87,160 | $11,840 | $75,320 |
| 2020 | $1,606 | $86,160 | $11,720 | $74,440 |
| 2019 | $201 | $84,640 | $11,520 | $73,120 |
| 2018 | $1,552 | $70,840 | $11,920 | $58,920 |
| 2017 | $1,165 | $57,600 | $6,760 | $50,840 |
| 2016 | $1,162 | $57,600 | $6,760 | $50,840 |
| 2015 | $1,876 | $49,360 | $5,800 | $43,560 |
| 2014 | -- | $42,880 | $9,560 | $33,320 |
Source: Public Records
Map
Nearby Homes
- 8 Collier Rd NW Unit A1
- 8 Collier Rd NW Unit B2
- 8 Collier Rd NW Unit B2
- 22 Collier Rd NW Unit 8
- 1861 Anjaco Rd NW
- 32 28th St NW Unit 204
- 32 28th St NW Unit 201
- 1820 Peachtree St NW Unit 914
- 1820 Peachtree St NW Unit 1205
- 1820 Peachtree St NW Unit 1507
- 1820 Peachtree St NW Unit 905
- 1820 Peachtree St NW Unit 804
- 1801 Huntington Hills Ln NW
- 104 Ardmore Place NW Unit 3
- 101 Ardmore Place NW Unit 3
- 96 Ardmore Place NW Unit 3
- 9 Palisades Rd NE
- 76 28th St NW
- 42 Camden Rd NE
- 346 Ardmore Ct NW
- 8 Collier Rd NW Unit B4
- 8 Collier Rd NW Unit B5
- 8 Collier Rd NW Unit A5
- 8 Collier Rd NW Unit C4
- 8 Collier Rd NW
- 8 Collier Rd NW
- 8 Collier Rd NW Unit C3
- 8 Collier Rd NW Unit A3
- 8 Collier Rd NW Unit C2
- 8 Collier Rd NW Unit A2
- 8 Collier Rd NW Unit C1
- 8 Collier Rd NW Unit B1
- 8 Collier Rd NW Unit C5
- 8 Collier Rd NW Unit B3
- 8 Collier Rd NW Unit A4
- 2 Collier Rd NW Unit 12
- 2 Collier Rd NW Unit 11
- 2 Collier Rd NW Unit 10
- 2 Collier Rd NW Unit 9
- 2 Collier Rd NW Unit 8