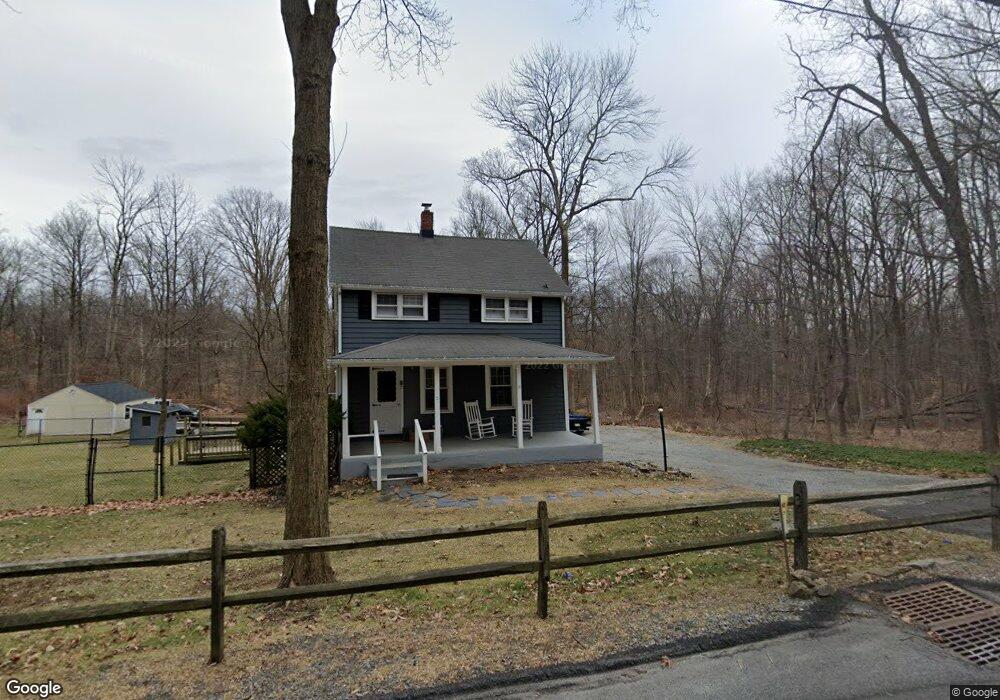
8 Combs Hollow Rd Mendham, NJ 07945
Estimated Value: $644,000 - $906,000
2
Beds
2
Baths
1,368
Sq Ft
$558/Sq Ft
Est. Value
About This Home
This home is located at 8 Combs Hollow Rd, Mendham, NJ 07945 and is currently estimated at $763,496, approximately $558 per square foot. 8 Combs Hollow Rd is a home located in Morris County with nearby schools including Mendham Township Elementary School, Mendham Township Middle School, and West Morris Mendham High School.
Ownership History
Date
Name
Owned For
Owner Type
Purchase Details
Closed on
Jun 24, 2021
Sold by
Borelli Cheryl
Bought by
Carr Michael T and Toscano Nikki
Current Estimated Value
Home Financials for this Owner
Home Financials are based on the most recent Mortgage that was taken out on this home.
Original Mortgage
$499,500
Outstanding Balance
$452,235
Interest Rate
2.9%
Mortgage Type
New Conventional
Estimated Equity
$311,261
Purchase Details
Closed on
Feb 20, 2020
Sold by
Borelli Vincent
Bought by
Borelli Vincent and Borelli Cheryl
Purchase Details
Closed on
May 10, 2018
Sold by
Clark Robert L and Clark Mary G
Bought by
Borelli Vincent R
Home Financials for this Owner
Home Financials are based on the most recent Mortgage that was taken out on this home.
Original Mortgage
$50,000
Interest Rate
4.4%
Mortgage Type
Unknown
Purchase Details
Closed on
Jan 14, 1974
Bought by
Clark Robert and Clark Mary G
Create a Home Valuation Report for This Property
The Home Valuation Report is an in-depth analysis detailing your home's value as well as a comparison with similar homes in the area
Home Values in the Area
Average Home Value in this Area
Purchase History
| Date | Buyer | Sale Price | Title Company |
|---|---|---|---|
| Carr Michael T | $555,000 | Liberty Abstract Inc | |
| Borelli Vincent | -- | None Available | |
| Borelli Vincent R | $435,000 | None Available | |
| Clark Robert | -- | -- |
Source: Public Records
Mortgage History
| Date | Status | Borrower | Loan Amount |
|---|---|---|---|
| Open | Carr Michael T | $499,500 | |
| Previous Owner | Borelli Vincent R | $50,000 |
Source: Public Records
Tax History Compared to Growth
Tax History
| Year | Tax Paid | Tax Assessment Tax Assessment Total Assessment is a certain percentage of the fair market value that is determined by local assessors to be the total taxable value of land and additions on the property. | Land | Improvement |
|---|---|---|---|---|
| 2025 | $12,650 | $714,300 | $505,000 | $209,300 |
| 2024 | $11,901 | $651,400 | $452,500 | $198,900 |
| 2023 | $11,901 | $569,700 | $401,000 | $168,700 |
| 2022 | $10,828 | $551,000 | $387,500 | $163,500 |
| 2021 | $10,828 | $489,300 | $375,000 | $114,300 |
| 2020 | $10,760 | $489,300 | $375,000 | $114,300 |
| 2019 | $10,559 | $489,300 | $375,000 | $114,300 |
| 2018 | $10,358 | $489,300 | $375,000 | $114,300 |
| 2017 | $10,119 | $489,300 | $375,000 | $114,300 |
| 2016 | $10,104 | $489,300 | $375,000 | $114,300 |
| 2015 | $9,668 | $489,300 | $375,000 | $114,300 |
| 2014 | $9,443 | $489,300 | $375,000 | $114,300 |
Source: Public Records
Map
Nearby Homes