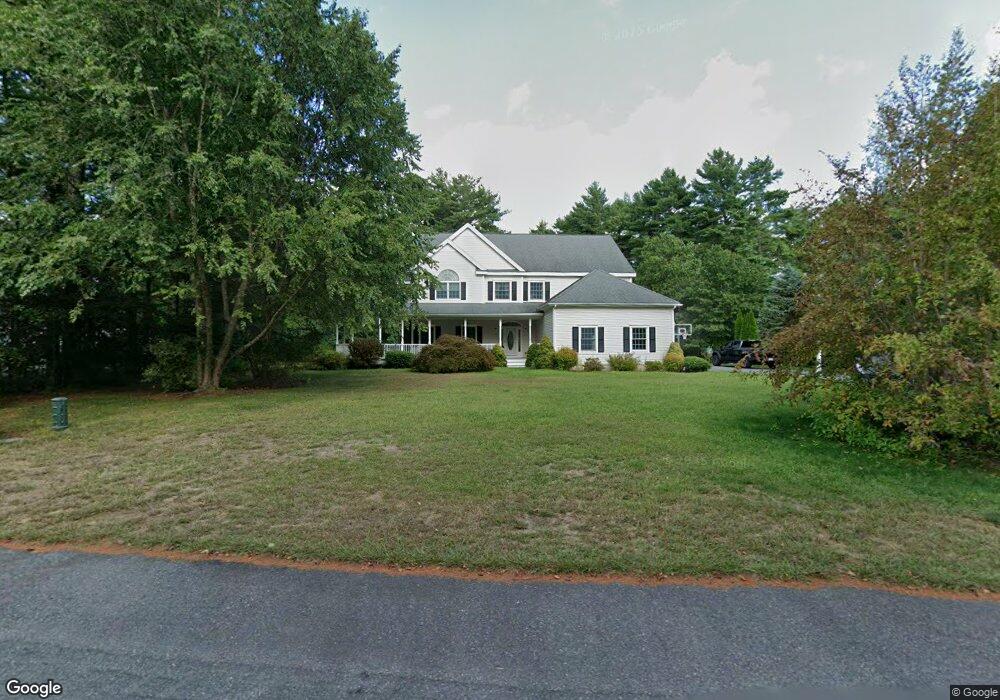
8 Commons Dr Carver, MA 02330
Estimated Value: $1,028,000 - $1,243,000
4
Beds
3
Baths
4,543
Sq Ft
$245/Sq Ft
Est. Value
About This Home
This home is located at 8 Commons Dr, Carver, MA 02330 and is currently estimated at $1,114,184, approximately $245 per square foot. 8 Commons Dr is a home located in Plymouth County with nearby schools including Carver Elementary School, Carver Middle/High School, and Map Academy Charter School.
Ownership History
Date
Name
Owned For
Owner Type
Purchase Details
Closed on
Dec 30, 2004
Sold by
Cramer Gilbert J and Cramer Antoinette M
Bought by
Mallon Shane M and Mallon Bridget L
Current Estimated Value
Home Financials for this Owner
Home Financials are based on the most recent Mortgage that was taken out on this home.
Original Mortgage
$499,200
Interest Rate
5.73%
Mortgage Type
Purchase Money Mortgage
Create a Home Valuation Report for This Property
The Home Valuation Report is an in-depth analysis detailing your home's value as well as a comparison with similar homes in the area
Home Values in the Area
Average Home Value in this Area
Purchase History
| Date | Buyer | Sale Price | Title Company |
|---|---|---|---|
| Mallon Shane M | $252,000 | -- |
Source: Public Records
Mortgage History
| Date | Status | Borrower | Loan Amount |
|---|---|---|---|
| Open | Mallon Shane M | $550,000 | |
| Closed | Mallon Shane M | $499,200 |
Source: Public Records
Tax History
| Year | Tax Paid | Tax Assessment Tax Assessment Total Assessment is a certain percentage of the fair market value that is determined by local assessors to be the total taxable value of land and additions on the property. | Land | Improvement |
|---|---|---|---|---|
| 2025 | $13,859 | $999,200 | $176,600 | $822,600 |
| 2024 | $13,772 | $971,900 | $200,800 | $771,100 |
| 2023 | $13,223 | $906,300 | $200,800 | $705,500 |
| 2022 | $12,439 | $778,400 | $171,700 | $606,700 |
| 2021 | $12,336 | $728,200 | $153,400 | $574,800 |
| 2020 | $11,727 | $682,200 | $143,300 | $538,900 |
| 2019 | $11,773 | $690,500 | $139,100 | $551,400 |
| 2018 | $11,155 | $632,700 | $139,100 | $493,600 |
| 2017 | $11,217 | $634,100 | $143,100 | $491,000 |
| 2016 | $10,395 | $610,400 | $136,300 | $474,100 |
| 2015 | $10,107 | $594,200 | $136,300 | $457,900 |
| 2014 | $9,366 | $550,600 | $172,300 | $378,300 |
Source: Public Records
Map
Nearby Homes
- 6 Twin Pines Ln Unit 6
- 13 Pond View Way
- 56 Bunnys Rd
- 58 Bunnys Rd
- 89 Silva St
- 81 Center St
- 0 Spring St
- 6 Susan Cir
- 241 Carver Rd Unit 7
- 42 Christmas Tree Ln
- 103 Esta Rd
- 6 Coachman Terrace
- 11 Brockton Ave
- 1 Pinehurst Dr
- 35 Silva St
- 6 Deer Hill Ln
- 19 Coachman Terrace
- 28 Brook St
- 2 Candlelight Dr
- 61 Esta Rd
Your Personal Tour Guide
Ask me questions while you tour the home.