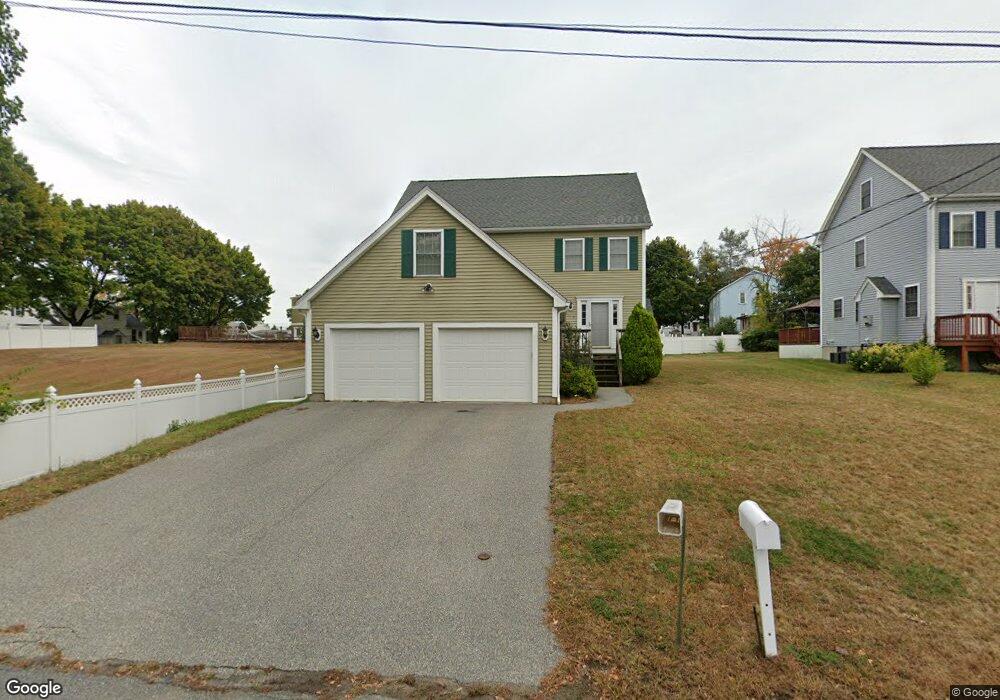
8 Court St Lawrence, MA 01843
Mount Vernon NeighborhoodEstimated Value: $671,339 - $822,000
3
Beds
3
Baths
2,114
Sq Ft
$352/Sq Ft
Est. Value
About This Home
This home is located at 8 Court St, Lawrence, MA 01843 and is currently estimated at $744,585, approximately $352 per square foot. 8 Court St is a home located in Essex County with nearby schools including John Breen School, School For Exceptional Studies, and Robert Frost Middle School.
Ownership History
Date
Name
Owned For
Owner Type
Purchase Details
Closed on
Jun 30, 2005
Sold by
Genesse Street Nt and Obrien
Bought by
Saba William C
Current Estimated Value
Home Financials for this Owner
Home Financials are based on the most recent Mortgage that was taken out on this home.
Original Mortgage
$157,000
Outstanding Balance
$81,281
Interest Rate
5.73%
Mortgage Type
Purchase Money Mortgage
Estimated Equity
$663,304
Purchase Details
Closed on
May 24, 2005
Sold by
Gauthier Arthur
Bought by
Genesse St Nt and Obrien
Home Financials for this Owner
Home Financials are based on the most recent Mortgage that was taken out on this home.
Original Mortgage
$157,000
Outstanding Balance
$81,281
Interest Rate
5.73%
Mortgage Type
Purchase Money Mortgage
Estimated Equity
$663,304
Create a Home Valuation Report for This Property
The Home Valuation Report is an in-depth analysis detailing your home's value as well as a comparison with similar homes in the area
Home Values in the Area
Average Home Value in this Area
Purchase History
| Date | Buyer | Sale Price | Title Company |
|---|---|---|---|
| Saba William C | $381,999 | -- | |
| Saba William C | $381,999 | -- | |
| Genesse St Nt | $30,000 | -- | |
| Genesse St Nt | $30,000 | -- | |
| Saba William C | $381,999 | -- | |
| Genesse St Nt | $30,000 | -- |
Source: Public Records
Mortgage History
| Date | Status | Borrower | Loan Amount |
|---|---|---|---|
| Open | Saba William C | $157,000 | |
| Closed | Saba William C | $157,000 |
Source: Public Records
Tax History
| Year | Tax Paid | Tax Assessment Tax Assessment Total Assessment is a certain percentage of the fair market value that is determined by local assessors to be the total taxable value of land and additions on the property. | Land | Improvement |
|---|---|---|---|---|
| 2025 | $5,379 | $611,300 | $196,800 | $414,500 |
| 2024 | $5,581 | $603,300 | $165,600 | $437,700 |
| 2023 | $5,842 | $575,000 | $147,900 | $427,100 |
| 2022 | $5,571 | $487,000 | $137,500 | $349,500 |
| 2021 | $5,283 | $430,600 | $134,400 | $296,200 |
| 2020 | $4,861 | $391,100 | $116,700 | $274,400 |
| 2019 | $5,332 | $389,800 | $115,300 | $274,500 |
| 2018 | $4,850 | $338,700 | $110,300 | $228,400 |
| 2017 | $4,697 | $306,200 | $109,000 | $197,200 |
| 2016 | $4,656 | $300,200 | $101,000 | $199,200 |
| 2015 | $4,539 | $300,200 | $101,000 | $199,200 |
Source: Public Records
Map
Nearby Homes
- 35 Adams St
- 96 Beacon St
- 0
- 23 Mount Vernon Cir
- 54 Amherst St
- 42 Beresford St
- 11 W Hawley St
- 37 Tewksbury St Unit 39
- 34 Leeds Terrace
- 9 Oakland Rd
- 87-87A Brookfield St
- 102 Weare St
- 21 Clubview Dr Unit 21
- 91-93 Newton St
- 24 Inman St Unit 6
- 24 Inman St Unit 4
- 49 Bowdoin St Unit 51
- 40 Chester St
- 341 S Broadway- Parcel II
- 22 Bobby Jones Dr
- 10 Court St
- 73 Beacon St
- 75 Beacon St
- 75 Beacon St Unit 1
- 7 Court St
- 17 Hale St
- 11 Genesee St
- 11 Hale St
- 71 Beacon St
- 21 Hale St Unit 23
- 79 Beacon St
- 359 Mount Vernon St Unit 363
- 69 Beacon St
- 357 Mount Vernon St
- 369 Mount Vernon St
- 20 Devonshire St
- 10 Genesee St
- 15 Genesee St
- 78 Beacon St
- 80 Beacon St