
Seller's Agent in 2013
Darien Ramirez
Berkshire Hathaway HomeServices Verani Realty Methuen
(978) 423-9585
1 in this area
34 Total Sales
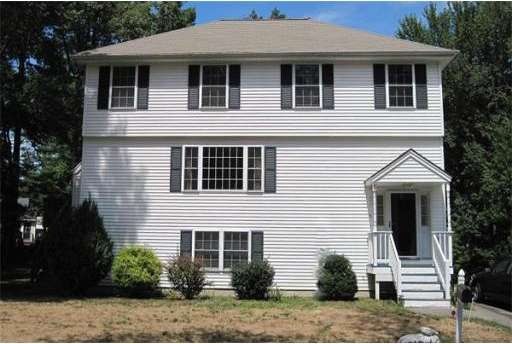
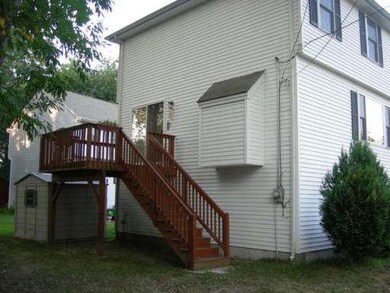
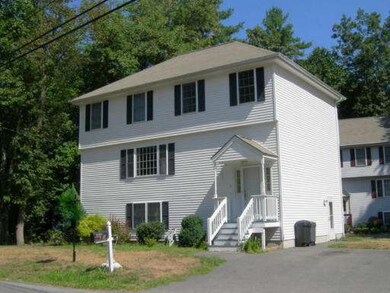
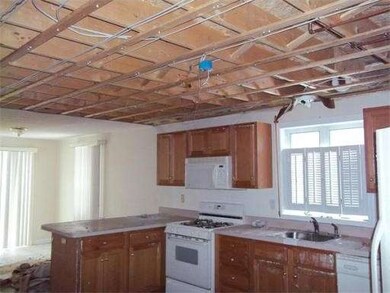

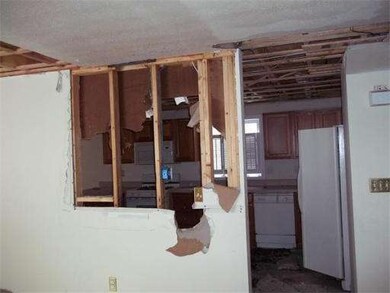
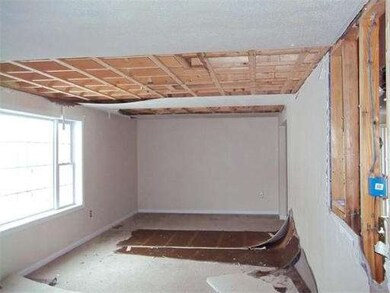
BANK APPROVED SHORT SALE PRICE - $177,900! Marsh School District! Property to be sold "AS IS-WHERE IS" due to burst/frozen pipe/flooding damage. See attached 'Before' damage and 'After' damage photos. Both electric and gas connections for dryer. Easy access to Rt. 93, 213, 495 & tax-free NH shopping. SEE ATTACHED PLOT PLAN regarding "the house in the back yard".
Home Type
Single Family
Est. Annual Taxes
$6,641
Year Built
2001
Lot Details
0
| Date | Type | Sale Price | Title Company |
|---|---|---|---|
| Not Resolvable | $317,000 | -- | |
| Not Resolvable | $165,000 | -- | |
| Deed | $262,000 | -- | |
| Deed | $262,000 | -- |
| Date | Status | Loan Amount | Loan Type |
|---|---|---|---|
| Open | $213,000 | Stand Alone Refi Refinance Of Original Loan | |
| Closed | $249,500 | Stand Alone Refi Refinance Of Original Loan | |
| Closed | $253,600 | New Conventional | |
| Previous Owner | $320,000 | No Value Available | |
| Previous Owner | $304,000 | No Value Available | |
| Previous Owner | $280,000 | No Value Available | |
| Previous Owner | $248,900 | Purchase Money Mortgage |
| Date | Event | Price | Change | Sq Ft Price |
|---|---|---|---|---|
| 11/14/2013 11/14/13 | Sold | $317,000 | 0.0% | $133 / Sq Ft |
| 11/11/2013 11/11/13 | Pending | -- | -- | -- |
| 10/17/2013 10/17/13 | Off Market | $317,000 | -- | -- |
| 10/16/2013 10/16/13 | Price Changed | $319,900 | 0.0% | $135 / Sq Ft |
| 10/16/2013 10/16/13 | For Sale | $319,900 | +10.3% | $135 / Sq Ft |
| 10/15/2013 10/15/13 | Pending | -- | -- | -- |
| 10/08/2013 10/08/13 | For Sale | $289,900 | +75.7% | $122 / Sq Ft |
| 07/08/2013 07/08/13 | Sold | $165,000 | -7.3% | $69 / Sq Ft |
| 05/15/2013 05/15/13 | Pending | -- | -- | -- |
| 03/01/2013 03/01/13 | Price Changed | $177,900 | -8.4% | $75 / Sq Ft |
| 02/12/2013 02/12/13 | Price Changed | $194,300 | -7.8% | $82 / Sq Ft |
| 01/16/2013 01/16/13 | Price Changed | $210,700 | -4.2% | $89 / Sq Ft |
| 10/04/2012 10/04/12 | For Sale | $220,000 | 0.0% | $93 / Sq Ft |
| 09/08/2012 09/08/12 | Pending | -- | -- | -- |
| 04/13/2012 04/13/12 | Price Changed | $220,000 | -2.2% | $93 / Sq Ft |
| 12/30/2011 12/30/11 | Price Changed | $224,900 | -2.2% | $95 / Sq Ft |
| 05/12/2011 05/12/11 | Price Changed | $229,900 | -8.0% | $97 / Sq Ft |
| 04/26/2011 04/26/11 | Price Changed | $249,957 | -3.1% | $105 / Sq Ft |
| 01/19/2011 01/19/11 | Price Changed | $257,957 | -0.8% | $109 / Sq Ft |
| 12/02/2010 12/02/10 | Price Changed | $259,957 | -7.1% | $109 / Sq Ft |
| 10/17/2010 10/17/10 | Price Changed | $279,957 | -6.7% | $118 / Sq Ft |
| 07/28/2010 07/28/10 | For Sale | $299,957 | -- | $126 / Sq Ft |
| Year | Tax Paid | Tax Assessment Tax Assessment Total Assessment is a certain percentage of the fair market value that is determined by local assessors to be the total taxable value of land and additions on the property. | Land | Improvement |
|---|---|---|---|---|
| 2025 | $6,641 | $627,700 | $210,200 | $417,500 |
| 2024 | $6,578 | $605,700 | $183,800 | $421,900 |
| 2023 | $6,300 | $538,500 | $161,700 | $376,800 |
| 2022 | $5,947 | $455,700 | $132,300 | $323,400 |
| 2021 | $5,575 | $422,700 | $125,000 | $297,700 |
| 2020 | $5,508 | $409,800 | $125,000 | $284,800 |
| 2019 | $5,389 | $379,800 | $117,600 | $262,200 |
| 2018 | $5,124 | $359,100 | $110,300 | $248,800 |
| 2017 | $4,936 | $336,900 | $110,300 | $226,600 |
| 2016 | $4,750 | $320,700 | $98,500 | $222,200 |
| 2015 | $4,552 | $311,800 | $98,500 | $213,300 |
Seller's Agent in 2013
Darien Ramirez
Berkshire Hathaway HomeServices Verani Realty Methuen
(978) 423-9585
1 in this area
34 Total Sales
Seller's Agent in 2013
Russell Ozana
ERA Key Realty Services
(617) 816-9943
7 Total Sales
L
Buyer's Agent in 2013
Lissa Deminie
Berkshire Hathaway HomeServices Verani Realty
Source: MLS Property Information Network (MLS PIN)
MLS Number: 71115726
APN: METH-000410-000126-B000008D
Disclaimer: Certain information contained herein is derived from information provided by parties other than Homes.com. All information provided is deemed reliable, but is not guaranteed to be accurate and should be independently verified.
![]() The property listing data and information, or the Images, set forth herein were provided to MLS Property Information Network, Inc. from third party sources, including sellers, lessors and public records, and were compiled by MLS Property Information Network, Inc. The property listing data and information, and the Images, are for the personal, non-commercial use of consumers having a good faith interest in purchasing or leasing listed properties of the type displayed to them and may not be used for any purpose other than to identify prospective properties which such consumers may have a good faith interest in purchasing or leasing. MLS Property Information Network, Inc. and its subscribers disclaim any and all representations and warranties as to the accuracy of the property listing data and information, or as to the accuracy of any of the Images, set forth herein.
The property listing data and information, or the Images, set forth herein were provided to MLS Property Information Network, Inc. from third party sources, including sellers, lessors and public records, and were compiled by MLS Property Information Network, Inc. The property listing data and information, and the Images, are for the personal, non-commercial use of consumers having a good faith interest in purchasing or leasing listed properties of the type displayed to them and may not be used for any purpose other than to identify prospective properties which such consumers may have a good faith interest in purchasing or leasing. MLS Property Information Network, Inc. and its subscribers disclaim any and all representations and warranties as to the accuracy of the property listing data and information, or as to the accuracy of any of the Images, set forth herein.