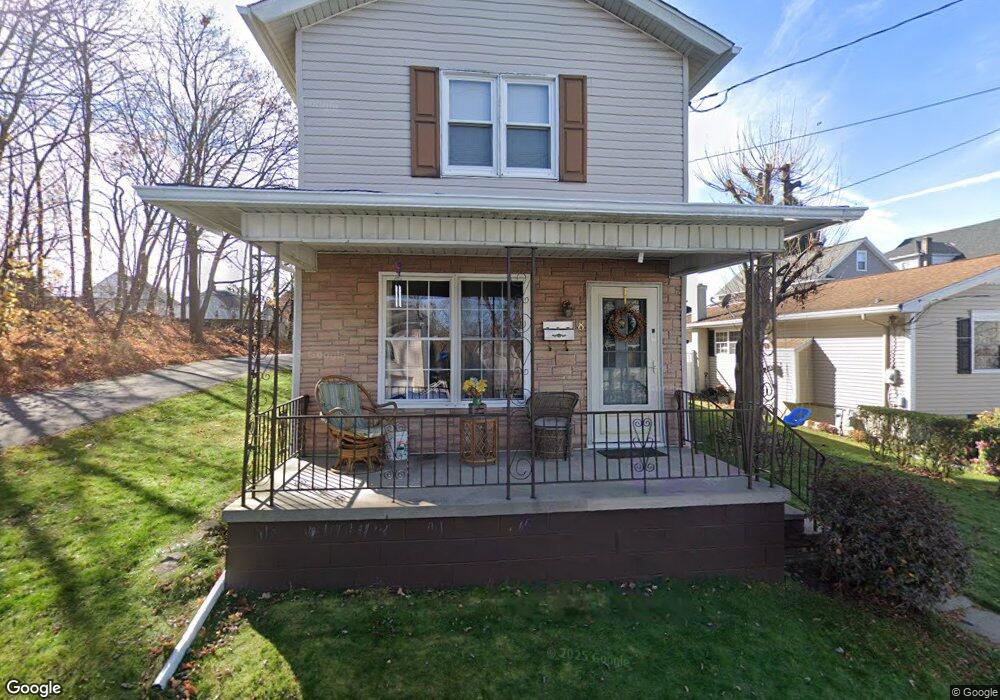
8 Depew St Pittston, PA 18640
Estimated Value: $146,928 - $192,000
2
Beds
1
Bath
1,184
Sq Ft
$139/Sq Ft
Est. Value
About This Home
This home is located at 8 Depew St, Pittston, PA 18640 and is currently estimated at $164,482, approximately $138 per square foot. 8 Depew St is a home located in Luzerne County with nearby schools including Pittston City Intermediate Center, Pittston Area Middle School, and Pittston Area Senior High School.
Ownership History
Date
Name
Owned For
Owner Type
Purchase Details
Closed on
Jun 18, 2014
Sold by
Oliveri James W and Oliveri Justin
Bought by
Haduck Stephen John
Current Estimated Value
Home Financials for this Owner
Home Financials are based on the most recent Mortgage that was taken out on this home.
Original Mortgage
$84,390
Outstanding Balance
$63,217
Interest Rate
4.19%
Mortgage Type
New Conventional
Estimated Equity
$101,265
Purchase Details
Closed on
Aug 17, 2005
Sold by
Estock John L and Kazmerick Shannon
Bought by
Oliveri Justin
Home Financials for this Owner
Home Financials are based on the most recent Mortgage that was taken out on this home.
Original Mortgage
$12,750
Interest Rate
5.81%
Mortgage Type
Stand Alone Second
Create a Home Valuation Report for This Property
The Home Valuation Report is an in-depth analysis detailing your home's value as well as a comparison with similar homes in the area
Home Values in the Area
Average Home Value in this Area
Purchase History
| Date | Buyer | Sale Price | Title Company |
|---|---|---|---|
| Haduck Stephen John | $87,000 | None Available | |
| Oliveri Justin | $85,000 | None Available |
Source: Public Records
Mortgage History
| Date | Status | Borrower | Loan Amount |
|---|---|---|---|
| Open | Haduck Stephen John | $84,390 | |
| Previous Owner | Oliveri Justin | $12,750 | |
| Previous Owner | Oliveri Justin | $68,000 |
Source: Public Records
Tax History
| Year | Tax Paid | Tax Assessment Tax Assessment Total Assessment is a certain percentage of the fair market value that is determined by local assessors to be the total taxable value of land and additions on the property. | Land | Improvement |
|---|---|---|---|---|
| 2026 | $2,002 | $87,100 | $21,300 | $65,800 |
| 2025 | $2,591 | $87,100 | $21,300 | $65,800 |
| 2024 | $2,591 | $87,100 | $21,300 | $65,800 |
| 2023 | $2,591 | $87,100 | $21,300 | $65,800 |
| 2022 | $2,575 | $87,100 | $21,300 | $65,800 |
| 2021 | $2,575 | $87,100 | $21,300 | $65,800 |
| 2020 | $2,526 | $87,100 | $21,300 | $65,800 |
| 2019 | $2,509 | $87,100 | $21,300 | $65,800 |
| 2018 | $2,466 | $87,100 | $21,300 | $65,800 |
| 2017 | $2,422 | $87,100 | $21,300 | $65,800 |
| 2016 | -- | $87,100 | $21,300 | $65,800 |
| 2015 | $1,597 | $87,100 | $21,300 | $65,800 |
| 2014 | $1,597 | $87,100 | $21,300 | $65,800 |
Source: Public Records
Map
Nearby Homes
Your Personal Tour Guide
Ask me questions while you tour the home.