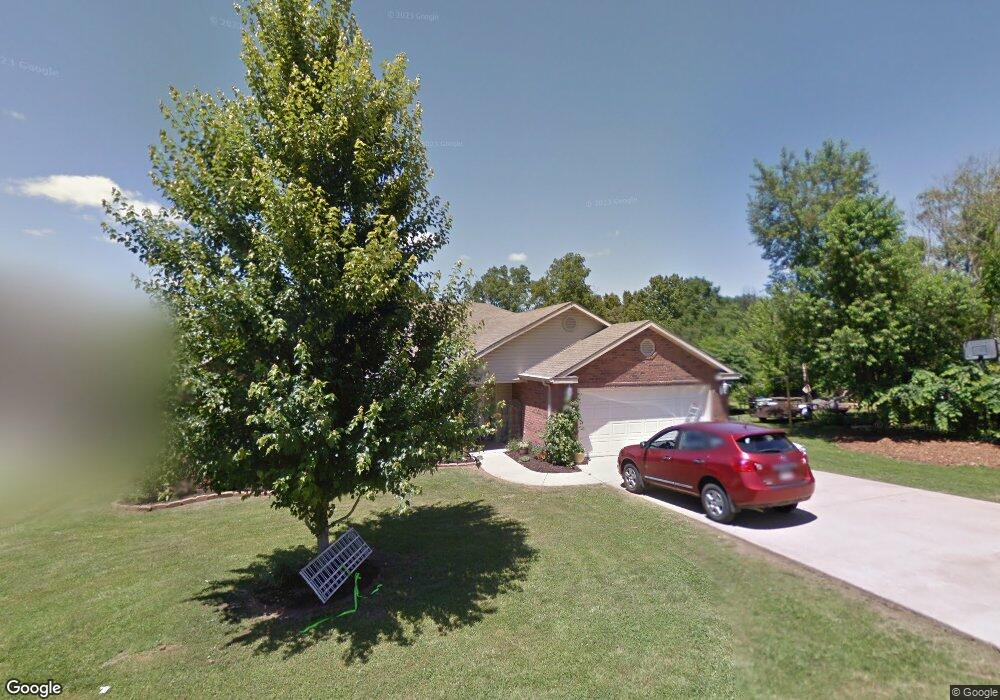
8 Dillow Place Bella Vista, AR 72714
Estimated Value: $354,000 - $371,000
3
Beds
2
Baths
1,790
Sq Ft
$202/Sq Ft
Est. Value
About This Home
This home is located at 8 Dillow Place, Bella Vista, AR 72714 and is currently estimated at $362,441, approximately $202 per square foot. 8 Dillow Place is a home located in Benton County with nearby schools including Cooper Elementary School, Ruth Barker Middle School, and Washington Junior High School.
Ownership History
Date
Name
Owned For
Owner Type
Purchase Details
Closed on
Aug 20, 2010
Sold by
Federal National Mortgage Association
Bought by
Peters Angela
Current Estimated Value
Home Financials for this Owner
Home Financials are based on the most recent Mortgage that was taken out on this home.
Original Mortgage
$118,405
Outstanding Balance
$78,129
Interest Rate
4.58%
Mortgage Type
FHA
Estimated Equity
$284,312
Purchase Details
Closed on
May 28, 2010
Sold by
Scarpinatto Miste
Bought by
Bac Home Loans Servicing Lp
Purchase Details
Closed on
Sep 27, 2006
Sold by
Reyes Victor
Bought by
Scarpinatto Miste M
Home Financials for this Owner
Home Financials are based on the most recent Mortgage that was taken out on this home.
Original Mortgage
$31,400
Interest Rate
6.44%
Mortgage Type
Stand Alone Second
Purchase Details
Closed on
Jan 3, 2006
Sold by
Hoggard Thomas L and Hoggard Gloria J
Bought by
Reyes Victor
Purchase Details
Closed on
Jul 21, 1988
Bought by
Hoggard
Create a Home Valuation Report for This Property
The Home Valuation Report is an in-depth analysis detailing your home's value as well as a comparison with similar homes in the area
Home Values in the Area
Average Home Value in this Area
Purchase History
| Date | Buyer | Sale Price | Title Company |
|---|---|---|---|
| Peters Angela | -- | None Available | |
| Bac Home Loans Servicing Lp | $98,331 | None Available | |
| Federal National Mortgage Association | -- | None Available | |
| Scarpinatto Miste M | $157,000 | Three Rivers Title Svcs Inc | |
| Reyes Victor | $12,000 | None Available | |
| Reyes Victor | $12,000 | None Available | |
| Hoggard | $8,200 | -- |
Source: Public Records
Mortgage History
| Date | Status | Borrower | Loan Amount |
|---|---|---|---|
| Open | Peters Angela | $118,405 | |
| Previous Owner | Scarpinatto Miste M | $31,400 |
Source: Public Records
Tax History Compared to Growth
Tax History
| Year | Tax Paid | Tax Assessment Tax Assessment Total Assessment is a certain percentage of the fair market value that is determined by local assessors to be the total taxable value of land and additions on the property. | Land | Improvement |
|---|---|---|---|---|
| 2025 | $2,434 | $61,179 | $1,600 | $59,579 |
| 2024 | $2,300 | $61,179 | $1,600 | $59,579 |
| 2023 | $2,190 | $40,890 | $800 | $40,090 |
| 2022 | $1,788 | $40,890 | $800 | $40,090 |
| 2021 | $1,685 | $40,890 | $800 | $40,090 |
| 2020 | $1,605 | $31,080 | $600 | $30,480 |
| 2019 | $1,605 | $31,080 | $600 | $30,480 |
| 2018 | $1,630 | $31,080 | $600 | $30,480 |
| 2017 | $1,471 | $31,080 | $600 | $30,480 |
| 2016 | $1,471 | $31,080 | $600 | $30,480 |
| 2015 | $1,706 | $28,290 | $1,000 | $27,290 |
| 2014 | $1,356 | $28,290 | $1,000 | $27,290 |
Source: Public Records
Map
Nearby Homes