8 Dover Ct Orinda, CA 94563
Central Orinda NeighborhoodEstimated Value: $2,551,000 - $3,392,000
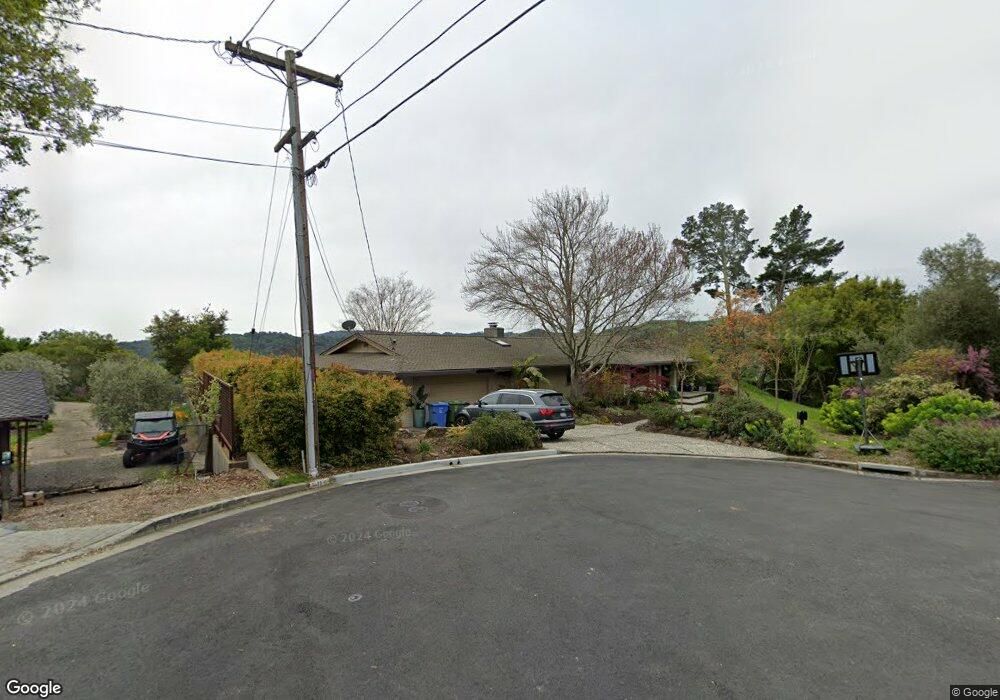
About This Home
This home is located at 8 Dover Ct, Orinda, CA 94563 and is currently estimated at $2,779,259, approximately $837 per square foot. 8 Dover Ct is a home located in Contra Costa County with nearby schools including Del Rey Elementary School, Orinda Intermediate School, and Miramonte High School.
Ownership History
We collect this data history from publicly available records. To have your information removed, we recommend requesting removal directly through your county’s website.
Purchase Details
Purchase Details
Purchase Details
Purchase Details
Home Values in the Area
Average Home Value in this Area
Purchase History
We collect this data history from publicly available records. To have your information removed, we recommend requesting removal directly through your county’s website.
| Date | Buyer | Sale Price | Title Company |
|---|---|---|---|
| $1,910,000 | First American Title Company | ||
| -- | First American Title Company | ||
| -- | None Available | ||
| -- | -- |
Tax History
We collect this data history from publicly available records. To have your information removed, we recommend requesting removal directly through your county’s website.
| Year | Tax Paid | Tax Assessment Tax Assessment Total Assessment is a certain percentage of the fair market value that is determined by local assessors to be the total taxable value of land and additions on the property. | Land | Improvement |
|---|---|---|---|---|
| 2025 | $28,259 | $2,295,524 | $1,562,401 | $733,123 |
| 2024 | $27,355 | $2,250,515 | $1,531,766 | $718,749 |
| 2023 | $27,355 | $2,206,388 | $1,501,732 | $704,656 |
| 2022 | $26,736 | $2,163,127 | $1,472,287 | $690,840 |
| 2021 | $26,202 | $2,120,714 | $1,443,419 | $677,295 |
| 2019 | $25,904 | $2,057,814 | $1,400,607 | $657,207 |
| 2018 | $23,840 | $2,017,466 | $1,373,145 | $644,321 |
| 2017 | $23,205 | $1,977,909 | $1,346,221 | $631,688 |
| 2016 | $22,647 | $1,939,127 | $1,319,825 | $619,302 |
| 2015 | $22,548 | $1,910,000 | $1,300,000 | $610,000 |
| 2014 | $8,872 | $667,383 | $237,138 | $430,245 |
Map
- 275 Orchard Rd
- 274 Orchard Rd
- 30 Greenwood Ct
- 28 Rheem Blvd
- 202 Glorietta Blvd
- 80 Rheem Blvd
- 106 Rheem Blvd
- 64 Valencia Rd
- 78 Scenic Dr
- 121 Ardith Dr
- 0 Glorietta Blvd Unit 41113128
- 205 Crestview Dr
- 136 Ardith Dr
- 0 Parklane Dr Unit 41125580
- 40 Hilldale Ct
- 102 Hillcrest Dr
- 90 Overhill Rd
- 25 Robert Rd
- 1 Oakview Terrace
- 31 Ascot Place
Ask me questions while you tour the home.