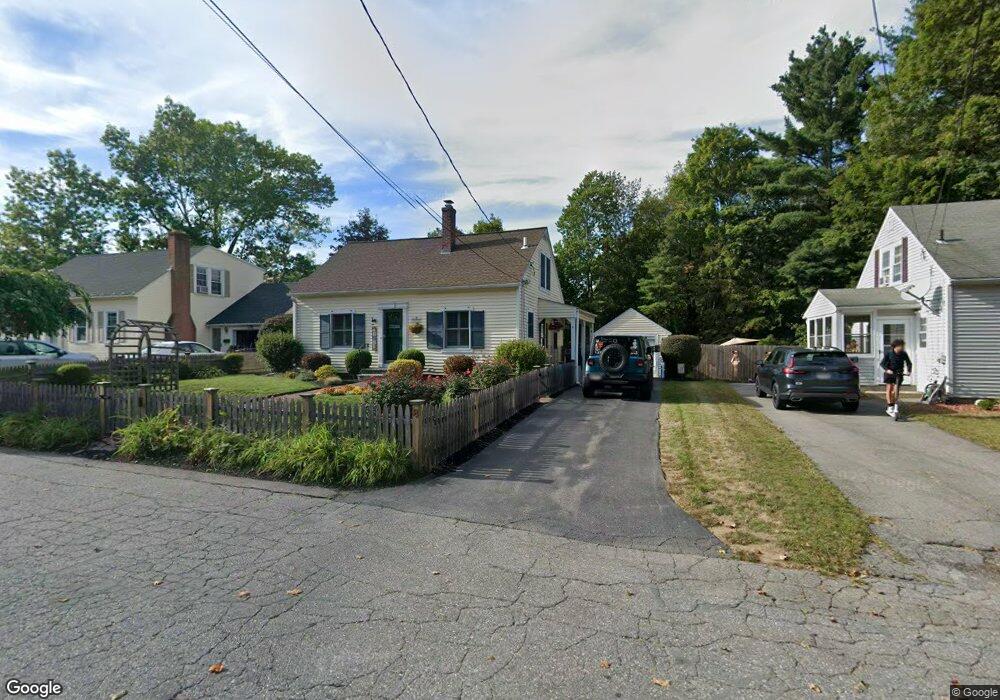
8 Doyle St Leominster, MA 01453
Estimated Value: $421,830 - $500,000
2
Beds
2
Baths
1,138
Sq Ft
$410/Sq Ft
Est. Value
About This Home
This home is located at 8 Doyle St, Leominster, MA 01453 and is currently estimated at $466,458, approximately $409 per square foot. 8 Doyle St is a home located in Worcester County with nearby schools including Leominster High School, St. Leo School, and St. Anna Catholic School.
Ownership History
Date
Name
Owned For
Owner Type
Purchase Details
Closed on
Nov 30, 2023
Sold by
Robert J Quirk Ret and Quirk
Bought by
Quirk Lauren M
Current Estimated Value
Purchase Details
Closed on
Sep 7, 2021
Sold by
Quirk Robert J
Bought by
Robert J Quirk Ret and Quirk
Purchase Details
Closed on
Oct 28, 2010
Sold by
Barbara A Gitto T A and Barbara Gitto-Panagiotes
Bought by
Quirk Robert J
Purchase Details
Closed on
Jul 10, 1997
Sold by
Deneen James E and Deneen Mildred M
Bought by
Gitto Barbara A
Create a Home Valuation Report for This Property
The Home Valuation Report is an in-depth analysis detailing your home's value as well as a comparison with similar homes in the area
Home Values in the Area
Average Home Value in this Area
Purchase History
| Date | Buyer | Sale Price | Title Company |
|---|---|---|---|
| Quirk Lauren M | -- | None Available | |
| Robert J Quirk Ret | -- | None Available | |
| Quirk Robert J | $214,900 | -- | |
| Gitto Barbara A | $105,000 | -- |
Source: Public Records
Tax History
| Year | Tax Paid | Tax Assessment Tax Assessment Total Assessment is a certain percentage of the fair market value that is determined by local assessors to be the total taxable value of land and additions on the property. | Land | Improvement |
|---|---|---|---|---|
| 2025 | $5,075 | $361,700 | $123,600 | $238,100 |
| 2024 | $4,855 | $334,600 | $117,700 | $216,900 |
| 2023 | $4,729 | $304,300 | $102,400 | $201,900 |
| 2022 | $4,584 | $276,800 | $89,000 | $187,800 |
| 2021 | $4,340 | $239,400 | $69,300 | $170,100 |
| 2020 | $3,981 | $221,400 | $69,300 | $152,100 |
| 2019 | $3,910 | $210,900 | $65,900 | $145,000 |
| 2018 | $3,847 | $199,000 | $64,000 | $135,000 |
| 2017 | $3,618 | $183,400 | $59,800 | $123,600 |
| 2016 | $3,522 | $179,900 | $59,800 | $120,100 |
| 2015 | $3,441 | $177,000 | $59,800 | $117,200 |
| 2014 | $3,413 | $180,700 | $63,300 | $117,400 |
Source: Public Records
Map
Nearby Homes
- 559 Merriam Ave
- 121 Cumberland Rd
- 158 Hall St
- 21 Porter St
- 525 Lindell Ave
- 204 Old Farm Rd
- 47 Hale St
- 212 Washington St
- 15 Arlington St
- 22 Columbia Ave
- 57 Winter St
- 54 N Main St
- 93 Benjamin St
- 59 Church St
- 60 Pearl St
- 57 Liberty St Unit 2
- 21 Whitman St
- 20 Pleasantview Ave
- 16 Depot Square
- 22 Prescott St
Your Personal Tour Guide
Ask me questions while you tour the home.