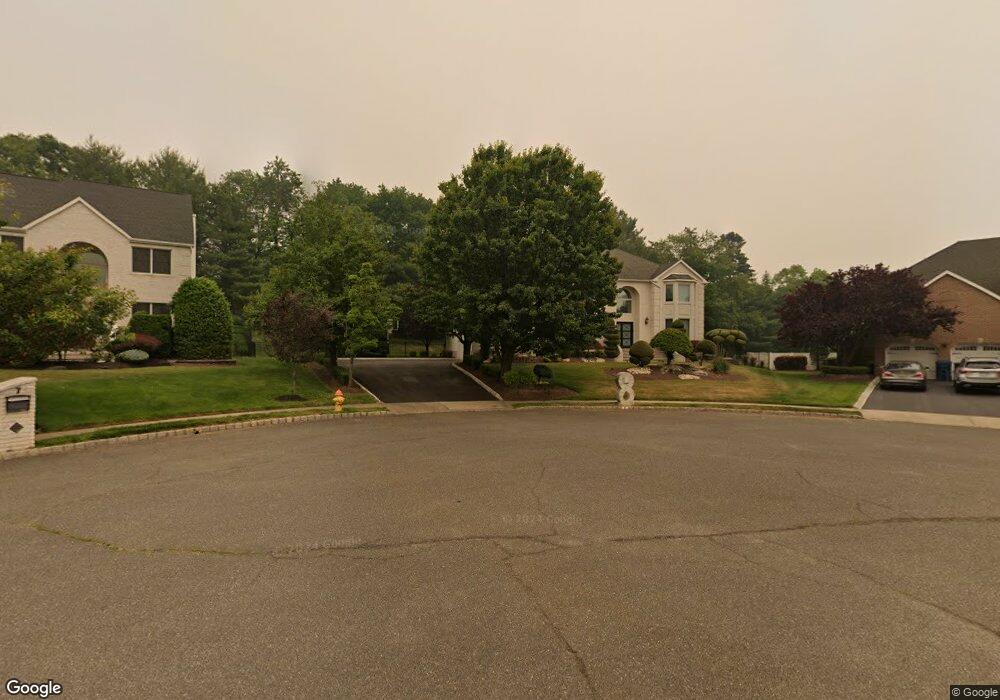
8 Drakes Hill Ct Morganville, NJ 07751
Estimated Value: $1,189,233 - $1,511,000
4
Beds
2
Baths
3,429
Sq Ft
$387/Sq Ft
Est. Value
About This Home
This home is located at 8 Drakes Hill Ct, Morganville, NJ 07751 and is currently estimated at $1,325,808, approximately $386 per square foot. 8 Drakes Hill Ct is a home located in Monmouth County with nearby schools including Frank Defino Central Elementary School, Marlboro Memorial Middle School, and Marlboro High School.
Ownership History
Date
Name
Owned For
Owner Type
Purchase Details
Closed on
Mar 15, 2010
Sold by
Stone Evelyn
Bought by
Goldfarb Natasha and Manevich Eric
Current Estimated Value
Home Financials for this Owner
Home Financials are based on the most recent Mortgage that was taken out on this home.
Original Mortgage
$555,000
Interest Rate
5.23%
Mortgage Type
New Conventional
Purchase Details
Closed on
Mar 25, 2006
Sold by
Stone David
Bought by
Stone Evelyn
Purchase Details
Closed on
Mar 30, 1999
Sold by
Highland Meadows Llc
Bought by
Szmigielski David and Szmigielski Evelyn
Home Financials for this Owner
Home Financials are based on the most recent Mortgage that was taken out on this home.
Original Mortgage
$331,200
Interest Rate
6.82%
Create a Home Valuation Report for This Property
The Home Valuation Report is an in-depth analysis detailing your home's value as well as a comparison with similar homes in the area
Home Values in the Area
Average Home Value in this Area
Purchase History
| Date | Buyer | Sale Price | Title Company |
|---|---|---|---|
| Goldfarb Natasha | $740,000 | None Available | |
| Stone Evelyn | -- | -- | |
| Szmigielski David | $414,300 | -- |
Source: Public Records
Mortgage History
| Date | Status | Borrower | Loan Amount |
|---|---|---|---|
| Previous Owner | Goldfarb Natasha | $555,000 | |
| Previous Owner | Szmigielski David | $331,200 |
Source: Public Records
Tax History Compared to Growth
Tax History
| Year | Tax Paid | Tax Assessment Tax Assessment Total Assessment is a certain percentage of the fair market value that is determined by local assessors to be the total taxable value of land and additions on the property. | Land | Improvement |
|---|---|---|---|---|
| 2025 | $17,376 | $688,700 | $231,400 | $457,300 |
| 2024 | $16,582 | $688,700 | $231,400 | $457,300 |
| 2023 | $16,582 | $686,900 | $231,400 | $455,500 |
| 2022 | $16,115 | $686,900 | $231,400 | $455,500 |
| 2021 | $15,895 | $686,900 | $231,400 | $455,500 |
| 2020 | $15,881 | $686,900 | $231,400 | $455,500 |
| 2019 | $15,895 | $686,900 | $231,400 | $455,500 |
| 2018 | $15,620 | $686,900 | $231,400 | $455,500 |
| 2017 | $15,318 | $686,900 | $231,400 | $455,500 |
| 2016 | $15,256 | $686,900 | $231,400 | $455,500 |
| 2015 | $15,010 | $686,000 | $231,400 | $454,600 |
| 2014 | $15,236 | $688,800 | $261,400 | $427,400 |
Source: Public Records
Map
Nearby Homes
- 222 Everton Blvd
- 219 Everton Blvd
- 142 Scarborough Way
- 138 Briarcliff Dr
- 193 Highway 79
- 1801 Wrangler Ave
- 333 Van Dusen Dr
- 50 Shawnee Way
- 211 Bradwick Way
- 108 Scarborough Way
- 157 Route 520
- 16 Pleasant Valley Rd
- 49 Rockwell Cir
- 30 Pleasant Valley Rd
- 26 Opatut Ct
- 68 Rockwell Cir
- 18 Egret Ln
- 680 - 21.04 County Road 520
- 680 - 21.1 County Road 520
- 680 - 21.21 County Road 520
- 6 Drakes Hill Ct
- 7 Drakes Hill Ct
- 12 Wyncrest Rd
- 4 Drakes Hill Ct
- 5 Drakes Hill Ct
- 108 Rolling Hill Dr
- 2 Drakes Hill Ct
- 1 Gloucester Dr
- 110 Rolling Hill Dr
- 11 Wyncrest Rd
- 5 Oran Place
- 9 Wyncrest Rd
- 3 Oran Place
- 7 Oran Place
- 1 Oran Place
- 1 Oran Place
- 112 Rolling Hill Dr
- 9 Oran Place
- 7 Wyncrest Rd
- 3 Gloucester Dr