8 Duval St Rehoboth, MA 02769
Estimated Value: $850,531 - $1,005,000
4
Beds
3
Baths
2,941
Sq Ft
$316/Sq Ft
Est. Value
About This Home
This home is located at 8 Duval St, Rehoboth, MA 02769 and is currently estimated at $929,383, approximately $316 per square foot. 8 Duval St is a home located in Bristol County with nearby schools including Dighton-Rehoboth Regional High School.
Ownership History
Date
Name
Owned For
Owner Type
Purchase Details
Closed on
Apr 20, 2007
Sold by
Cedar Hill Ests Llc
Bought by
Wheeler Joshua C and Wheeler Jennifer L
Current Estimated Value
Home Financials for this Owner
Home Financials are based on the most recent Mortgage that was taken out on this home.
Original Mortgage
$512,000
Outstanding Balance
$310,249
Interest Rate
6.19%
Mortgage Type
Purchase Money Mortgage
Estimated Equity
$619,134
Create a Home Valuation Report for This Property
The Home Valuation Report is an in-depth analysis detailing your home's value as well as a comparison with similar homes in the area
Home Values in the Area
Average Home Value in this Area
Purchase History
| Date | Buyer | Sale Price | Title Company |
|---|---|---|---|
| Wheeler Joshua C | $275,000 | -- |
Source: Public Records
Mortgage History
| Date | Status | Borrower | Loan Amount |
|---|---|---|---|
| Open | Wheeler Joshua C | $512,000 |
Source: Public Records
Tax History Compared to Growth
Tax History
| Year | Tax Paid | Tax Assessment Tax Assessment Total Assessment is a certain percentage of the fair market value that is determined by local assessors to be the total taxable value of land and additions on the property. | Land | Improvement |
|---|---|---|---|---|
| 2025 | $86 | $773,300 | $219,700 | $553,600 |
| 2024 | $8,506 | $748,800 | $219,700 | $529,100 |
| 2023 | $7,855 | $678,300 | $215,300 | $463,000 |
| 2022 | $7,440 | $587,200 | $198,400 | $388,800 |
| 2021 | $3,014 | $562,600 | $181,800 | $380,800 |
| 2020 | $7,423 | $565,800 | $185,000 | $380,800 |
| 2018 | $5,289 | $530,600 | $181,300 | $349,300 |
| 2017 | $2,715 | $493,500 | $188,900 | $304,600 |
| 2016 | $6,090 | $501,200 | $196,600 | $304,600 |
| 2015 | $5,844 | $474,700 | $188,000 | $286,700 |
| 2014 | $5,797 | $466,000 | $179,300 | $286,700 |
Source: Public Records
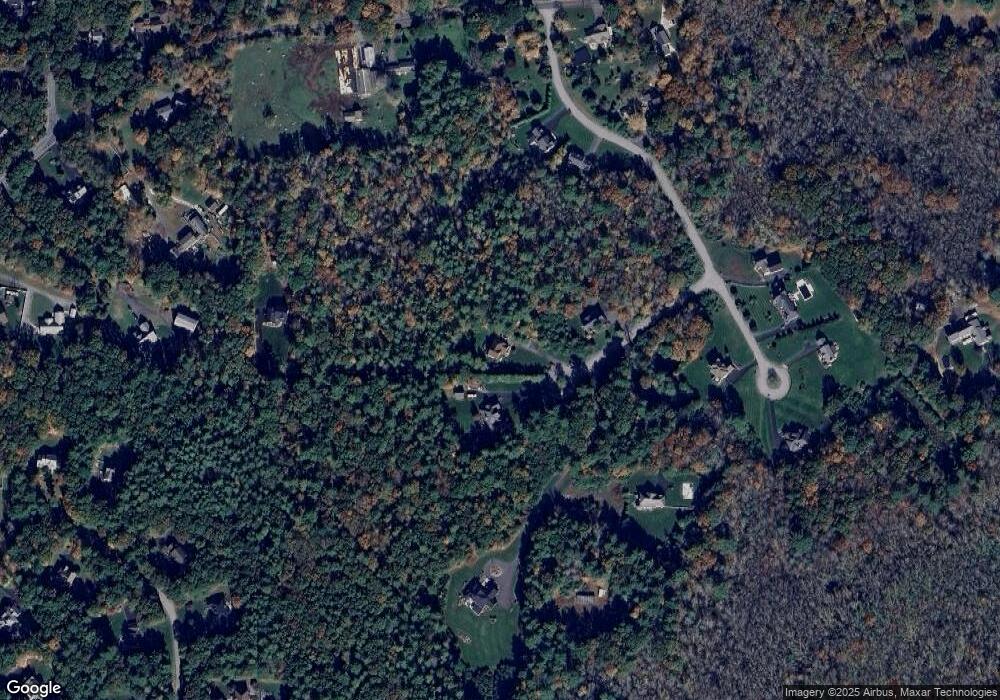
Map
Nearby Homes