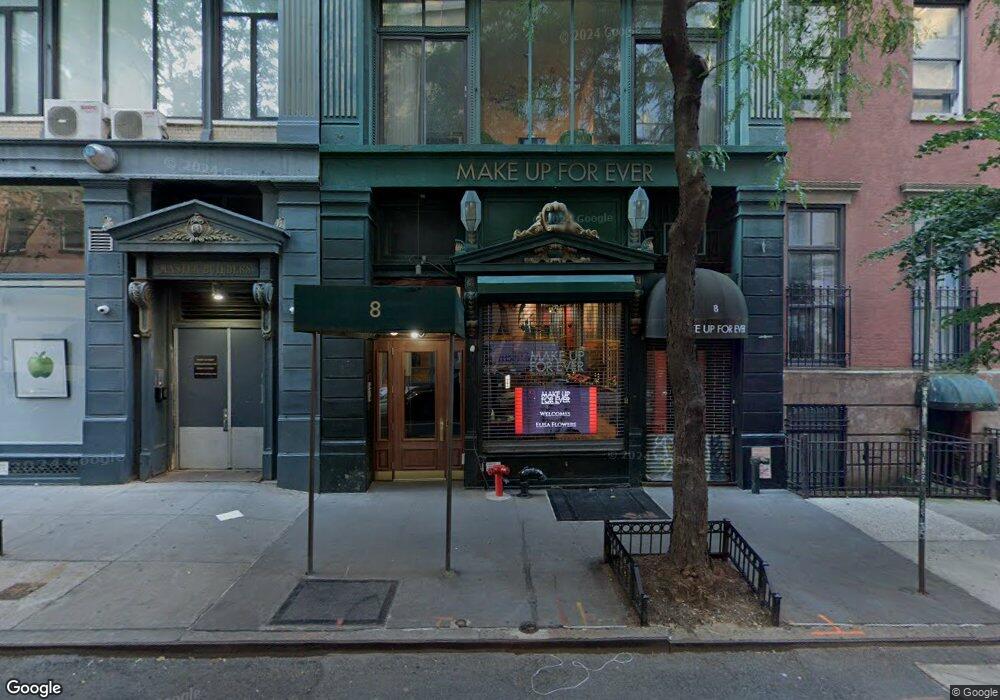
8 E 12th St Unit 11 New York, NY 10003
Greenwich Village NeighborhoodEstimated Value: $3,474,000 - $4,963,000
2
Beds
2
Baths
2,330
Sq Ft
$1,704/Sq Ft
Est. Value
About This Home
This home is located at 8 E 12th St Unit 11, New York, NY 10003 and is currently estimated at $3,970,010, approximately $1,703 per square foot. 8 E 12th St Unit 11 is a home located in New York County with nearby schools including P.S. 41 Greenwich Village, Clinton School, and Middle School 297.
Ownership History
Date
Name
Owned For
Owner Type
Purchase Details
Closed on
Mar 10, 2023
Sold by
Villager 11 Llc
Bought by
Brian H Whipple 2012 Family Trust and Brian H. Whipple, Trustee
Current Estimated Value
Purchase Details
Closed on
Sep 1, 2016
Sold by
8 East 12Th Street Llc and Fischrund Levine %
Bought by
Villager 11 Llc
Home Financials for this Owner
Home Financials are based on the most recent Mortgage that was taken out on this home.
Original Mortgage
$3,000,000
Interest Rate
3.45%
Mortgage Type
Purchase Money Mortgage
Purchase Details
Closed on
Mar 8, 2013
Sold by
David Sonenberg As Trustee
Bought by
8 East 12 Street Llc
Purchase Details
Closed on
Nov 26, 2012
Sold by
Kusama-Hinte Jeffrey
Bought by
David Sonenberg As Trustee and Kusama-Hinte Children'S Trust
Purchase Details
Closed on
Apr 30, 2010
Sold by
Levy-Church Jeanne
Bought by
Kusama-Hinte Jeffrey and Levy-Church, Jeanne
Create a Home Valuation Report for This Property
The Home Valuation Report is an in-depth analysis detailing your home's value as well as a comparison with similar homes in the area
Home Values in the Area
Average Home Value in this Area
Purchase History
| Date | Buyer | Sale Price | Title Company |
|---|---|---|---|
| Brian H Whipple 2012 Family Trust | $4,973,000 | -- | |
| Villager 11 Llc | $4,600,000 | -- | |
| 8 East 12 Street Llc | $3,100,000 | -- | |
| David Sonenberg As Trustee | -- | -- | |
| Kusama-Hinte Jeffrey | $1,250,000 | -- |
Source: Public Records
Mortgage History
| Date | Status | Borrower | Loan Amount |
|---|---|---|---|
| Previous Owner | Villager 11 Llc | $3,000,000 |
Source: Public Records
Tax History Compared to Growth
Tax History
| Year | Tax Paid | Tax Assessment Tax Assessment Total Assessment is a certain percentage of the fair market value that is determined by local assessors to be the total taxable value of land and additions on the property. | Land | Improvement |
|---|---|---|---|---|
| 2025 | $28,419 | $241,137 | $14,637 | $226,500 |
| 2024 | $28,419 | $227,319 | $14,637 | $212,682 |
| 2023 | $26,635 | $217,128 | $14,637 | $202,491 |
| 2022 | $25,657 | $231,480 | $14,637 | $216,843 |
| 2021 | $24,589 | $200,447 | $14,637 | $185,810 |
| 2020 | $24,787 | $224,397 | $14,637 | $209,760 |
| 2019 | $23,589 | $196,097 | $14,637 | $181,460 |
| 2018 | $22,403 | $196,097 | $14,636 | $181,461 |
| 2017 | $20,935 | $193,658 | $14,637 | $179,021 |
| 2016 | $19,680 | $183,375 | $14,637 | $168,738 |
| 2015 | $10,232 | $165,960 | $14,637 | $151,323 |
| 2014 | $10,232 | $141,641 | $14,637 | $127,004 |
Source: Public Records
Map
Nearby Homes
- 51 5th Ave Unit 7E
- 21 E 11th St Unit 3
- 45 5th Ave Unit 16C
- 45 5th Ave Unit 9D
- 21 E 12th St Unit 8A
- 21 E 12th St Unit 19B
- 41 5th Ave Unit 1F
- 39 5th Ave Unit 8D
- 39 5th Ave Unit 2B
- 116 University Place Unit 5
- 40 5th Ave Unit 7E
- 21 E 10th St Unit 7D
- 21 E 10th St Unit PHW
- 21 E 10th St
- 15 W 11th St Unit 7A
- 15 W 11th St Unit 7AB
- 15 W 11th St Unit 7B
- 48 E 13th St Unit 8B
- 35 E 12th St Unit 2AB
- 23 E 10th St Unit 508
- 8 E 12th St Unit 12
- 8 E 12th St Unit 10
- 8 E 12th St Unit 9
- 8 E 12th St Unit 8
- 8 E 12th St Unit 7
- 8 E 12th St Unit 6
- 8 E 12th St Unit 5
- 8 E 12th St Unit 4
- 8 E 12th St Unit 3
- 8 E 12th St Unit 2
- 8 E 12th St Unit 1
- 8 E 12th St
- 8 E 12th St Unit 8/9
- 6 E 12th St Unit Parlour
- 6 E 12th St Unit 1
- 6 E 12th St
- 6 E 12th St Unit 4
- 6 E 12th St Unit 3
- 6 E 12th St Unit 2
- 12 E 12th St