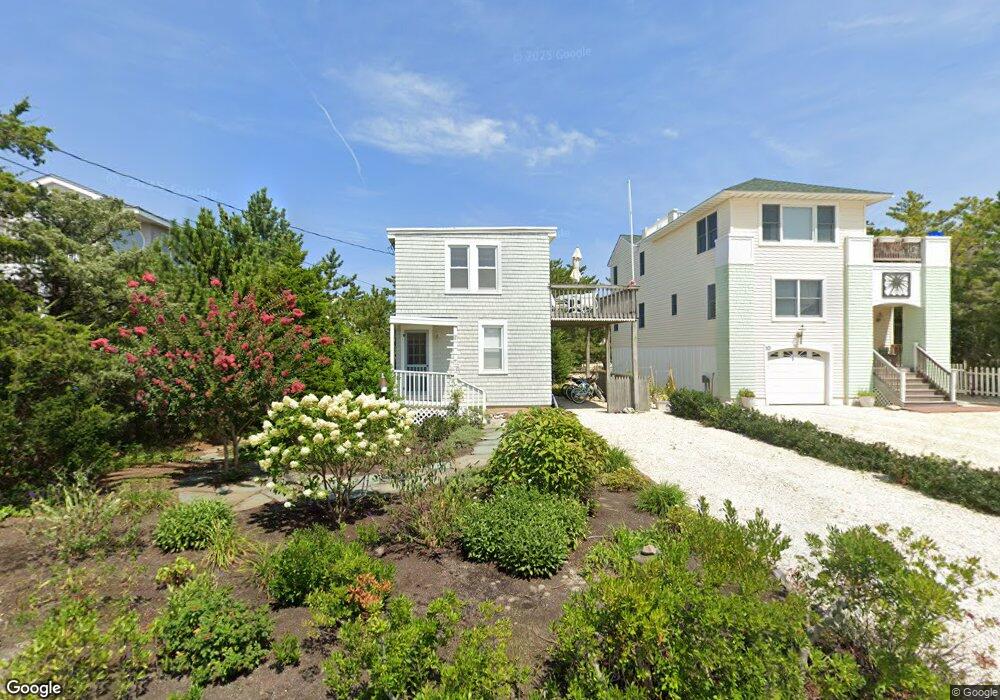
8 E 28th St Barnegat Light, NJ 08006
Long Beach Island NeighborhoodEstimated Value: $1,224,000 - $2,314,000
2
Beds
1
Bath
1,024
Sq Ft
$1,549/Sq Ft
Est. Value
About This Home
This home is located at 8 E 28th St, Barnegat Light, NJ 08006 and is currently estimated at $1,585,851, approximately $1,548 per square foot. 8 E 28th St is a home with nearby schools including Ethel A. Jacobsen Elementary School, Long Beach Island Grade School, and Southern Regional Middle School.
Ownership History
Date
Name
Owned For
Owner Type
Purchase Details
Closed on
Jun 6, 2024
Sold by
Shipps David Huntington Woolston
Bought by
Shipps Tennessee Community Property Trust and Shipps
Current Estimated Value
Purchase Details
Closed on
Jan 2, 2019
Sold by
Shipps Louise H and Shiips Louise H
Bought by
Shipps Louis H and Thbe Louise H Shipps Revocable
Purchase Details
Closed on
Aug 6, 2003
Sold by
Page Florence
Bought by
Page Woodrow and Wright Catherine
Create a Home Valuation Report for This Property
The Home Valuation Report is an in-depth analysis detailing your home's value as well as a comparison with similar homes in the area
Home Values in the Area
Average Home Value in this Area
Purchase History
| Date | Buyer | Sale Price | Title Company |
|---|---|---|---|
| Shipps Tennessee Community Property Trust | -- | None Listed On Document | |
| Shipps David Huntington W | -- | None Listed On Document | |
| Shipps Louis H | -- | None Available | |
| Page Woodrow | -- | -- |
Source: Public Records
Tax History Compared to Growth
Tax History
| Year | Tax Paid | Tax Assessment Tax Assessment Total Assessment is a certain percentage of the fair market value that is determined by local assessors to be the total taxable value of land and additions on the property. | Land | Improvement |
|---|---|---|---|---|
| 2025 | $6,588 | $653,600 | $546,300 | $107,300 |
| 2024 | $5,824 | $653,600 | $546,300 | $107,300 |
| 2023 | $5,405 | $653,600 | $546,300 | $107,300 |
| 2022 | $5,405 | $653,600 | $546,300 | $107,300 |
| 2021 | $5,817 | $653,600 | $546,300 | $107,300 |
| 2020 | $5,902 | $653,600 | $546,300 | $107,300 |
| 2019 | $5,686 | $653,600 | $546,300 | $107,300 |
| 2018 | $5,588 | $653,600 | $546,300 | $107,300 |
| 2017 | $5,784 | $653,600 | $546,300 | $107,300 |
| 2016 | $5,634 | $653,600 | $546,300 | $107,300 |
| 2015 | $5,431 | $653,600 | $546,300 | $107,300 |
| 2014 | $5,909 | $653,700 | $546,300 | $107,400 |
Source: Public Records
Map
Nearby Homes