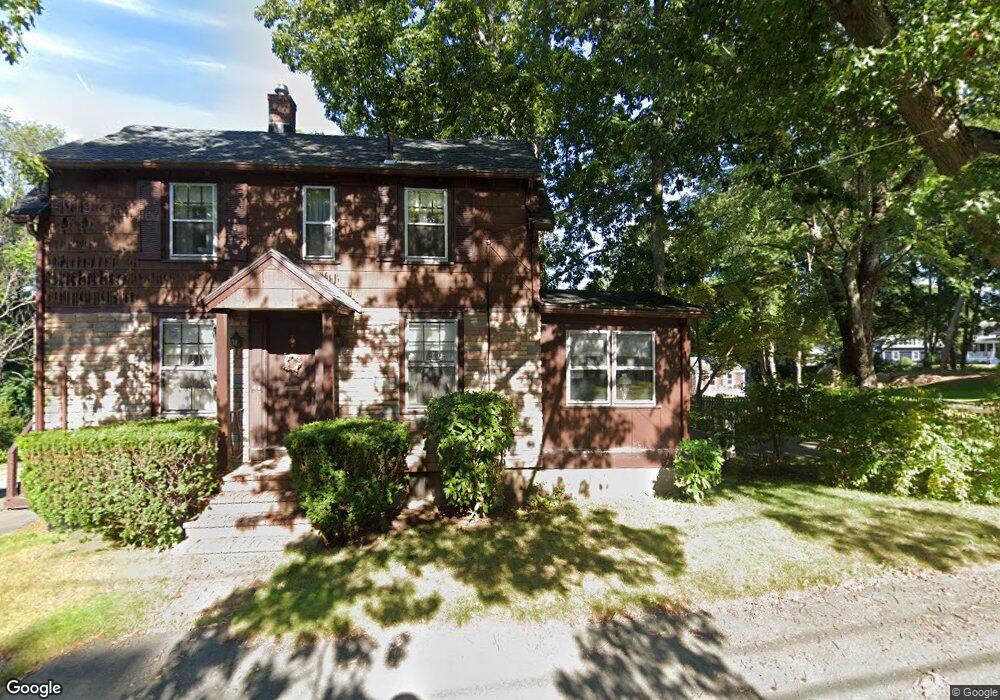
8 East St Beverly, MA 01915
Beverly Cove NeighborhoodEstimated Value: $885,000 - $900,000
3
Beds
3
Baths
1,800
Sq Ft
$496/Sq Ft
Est. Value
About This Home
This home is located at 8 East St, Beverly, MA 01915 and is currently estimated at $892,354, approximately $495 per square foot. 8 East St is a home located in Essex County with nearby schools including Beverly High School, Mrs Alexander's School, and Harborlight Montessori School.
Ownership History
Date
Name
Owned For
Owner Type
Purchase Details
Closed on
Aug 31, 2004
Sold by
Sirva Relocation Llc
Bought by
Taormina Anthony R and Taormina Megan B
Current Estimated Value
Home Financials for this Owner
Home Financials are based on the most recent Mortgage that was taken out on this home.
Original Mortgage
$48,500
Outstanding Balance
$24,252
Interest Rate
6.02%
Mortgage Type
Purchase Money Mortgage
Estimated Equity
$868,102
Purchase Details
Closed on
Mar 31, 1992
Sold by
Century No Shore B & T
Bought by
M T S Rt
Home Financials for this Owner
Home Financials are based on the most recent Mortgage that was taken out on this home.
Original Mortgage
$145,000
Interest Rate
8.66%
Mortgage Type
Purchase Money Mortgage
Create a Home Valuation Report for This Property
The Home Valuation Report is an in-depth analysis detailing your home's value as well as a comparison with similar homes in the area
Home Values in the Area
Average Home Value in this Area
Purchase History
| Date | Buyer | Sale Price | Title Company |
|---|---|---|---|
| Taormina Anthony R | $485,000 | -- | |
| Sirva Relocation Llc | $485,000 | -- | |
| M T S Rt | $56,500 | -- |
Source: Public Records
Mortgage History
| Date | Status | Borrower | Loan Amount |
|---|---|---|---|
| Open | M T S Rt | $48,500 | |
| Open | M T S Rt | $388,000 | |
| Previous Owner | M T S Rt | $145,000 |
Source: Public Records
Tax History Compared to Growth
Tax History
| Year | Tax Paid | Tax Assessment Tax Assessment Total Assessment is a certain percentage of the fair market value that is determined by local assessors to be the total taxable value of land and additions on the property. | Land | Improvement |
|---|---|---|---|---|
| 2025 | $7,596 | $691,200 | $415,200 | $276,000 |
| 2024 | $7,165 | $638,000 | $362,000 | $276,000 |
| 2023 | $6,884 | $611,400 | $335,400 | $276,000 |
| 2022 | $6,601 | $542,400 | $264,400 | $278,000 |
| 2021 | $6,525 | $513,800 | $252,000 | $261,800 |
| 2020 | $6,296 | $490,700 | $228,900 | $261,800 |
| 2019 | $6,132 | $464,200 | $209,400 | $254,800 |
| 2018 | $6,062 | $445,700 | $204,100 | $241,600 |
| 2017 | $6,055 | $424,000 | $177,400 | $246,600 |
| 2016 | $5,668 | $393,900 | $147,300 | $246,600 |
| 2015 | $5,167 | $366,200 | $139,900 | $226,300 |
Source: Public Records
Map
Nearby Homes
- 13 Parsons Dr
- 4 Penny Ln
- 156 Hale St
- 6 Ober St Unit 3
- 14 Foster Dr
- 7 Morgan Rd
- 56 Baker Ave
- 39 & 41 Woodbury St
- 42 Baker Ave
- 7 Harrison Ave
- The Cabot Collection
- 22 Whitehall Cir
- 31 Elliott St Unit 2B
- 19 Pond St
- 247 Hale St
- 70 Chase St
- 315 Rantoul St Unit 402
- 5 Beckford St Unit 3
- 9 Swan St Unit 2
- 9 Swan St Unit 3