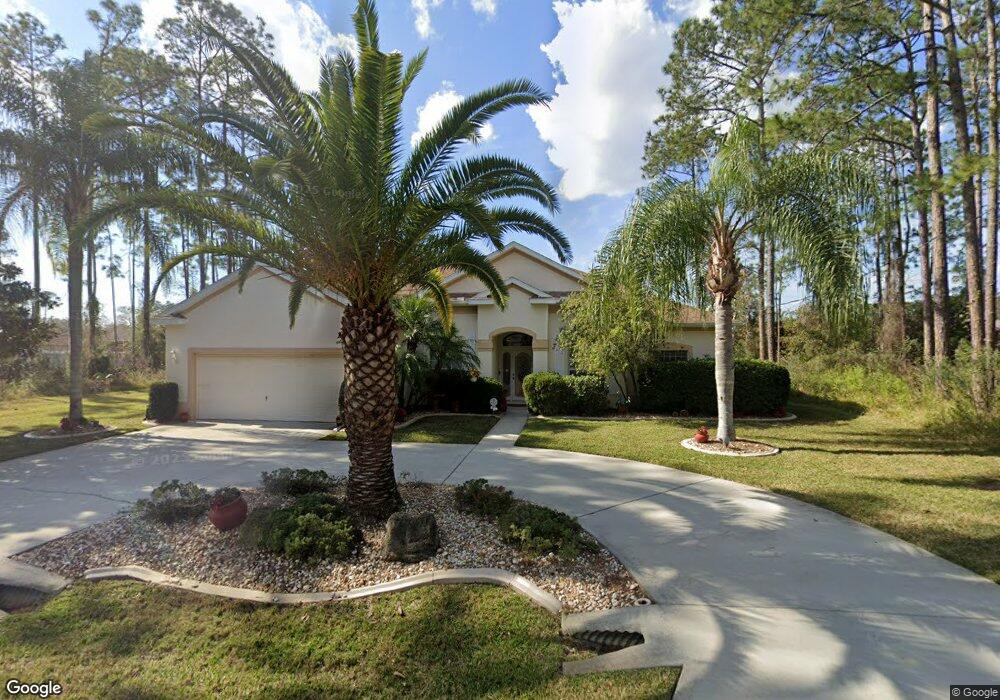
8 Edgemont Ln Palm Coast, FL 32164
Estimated Value: $479,000 - $585,000
--
Bed
3
Baths
2,545
Sq Ft
$205/Sq Ft
Est. Value
About This Home
This home is located at 8 Edgemont Ln, Palm Coast, FL 32164 and is currently estimated at $521,188, approximately $204 per square foot. 8 Edgemont Ln is a home located in Flagler County with nearby schools including Bunnell Elementary School, Buddy Taylor Middle School, and Flagler-Palm Coast High School.
Ownership History
Date
Name
Owned For
Owner Type
Purchase Details
Closed on
Jul 8, 2005
Sold by
Malkiewicz Richard
Bought by
Mason Nathaniel and Mason Sandra R
Current Estimated Value
Home Financials for this Owner
Home Financials are based on the most recent Mortgage that was taken out on this home.
Original Mortgage
$326,979
Outstanding Balance
$180,615
Interest Rate
5.62%
Mortgage Type
Construction
Estimated Equity
$340,573
Purchase Details
Closed on
Jul 2, 1996
Sold by
Malkiewicz Walter
Bought by
Malkiewicz Richard
Create a Home Valuation Report for This Property
The Home Valuation Report is an in-depth analysis detailing your home's value as well as a comparison with similar homes in the area
Home Values in the Area
Average Home Value in this Area
Purchase History
| Date | Buyer | Sale Price | Title Company |
|---|---|---|---|
| Mason Nathaniel | $95,000 | Americas Choice Title Co | |
| Malkiewicz Richard | -- | -- |
Source: Public Records
Mortgage History
| Date | Status | Borrower | Loan Amount |
|---|---|---|---|
| Open | Mason Nathaniel | $326,979 |
Source: Public Records
Tax History Compared to Growth
Tax History
| Year | Tax Paid | Tax Assessment Tax Assessment Total Assessment is a certain percentage of the fair market value that is determined by local assessors to be the total taxable value of land and additions on the property. | Land | Improvement |
|---|---|---|---|---|
| 2024 | $6,403 | $381,753 | $58,500 | $323,253 |
| 2023 | $6,403 | $331,781 | $0 | $0 |
| 2022 | $6,088 | $364,441 | $59,500 | $304,941 |
| 2021 | $5,338 | $274,199 | $35,000 | $239,199 |
| 2020 | $5,034 | $254,470 | $29,000 | $225,470 |
| 2019 | $5,121 | $255,970 | $30,500 | $225,470 |
| 2018 | $5,027 | $246,720 | $30,000 | $216,720 |
| 2017 | $4,739 | $232,433 | $25,000 | $207,433 |
| 2016 | $4,558 | $223,569 | $0 | $0 |
| 2015 | $4,466 | $217,454 | $0 | $0 |
| 2014 | $4,358 | $209,913 | $0 | $0 |
Source: Public Records
Map
Nearby Homes