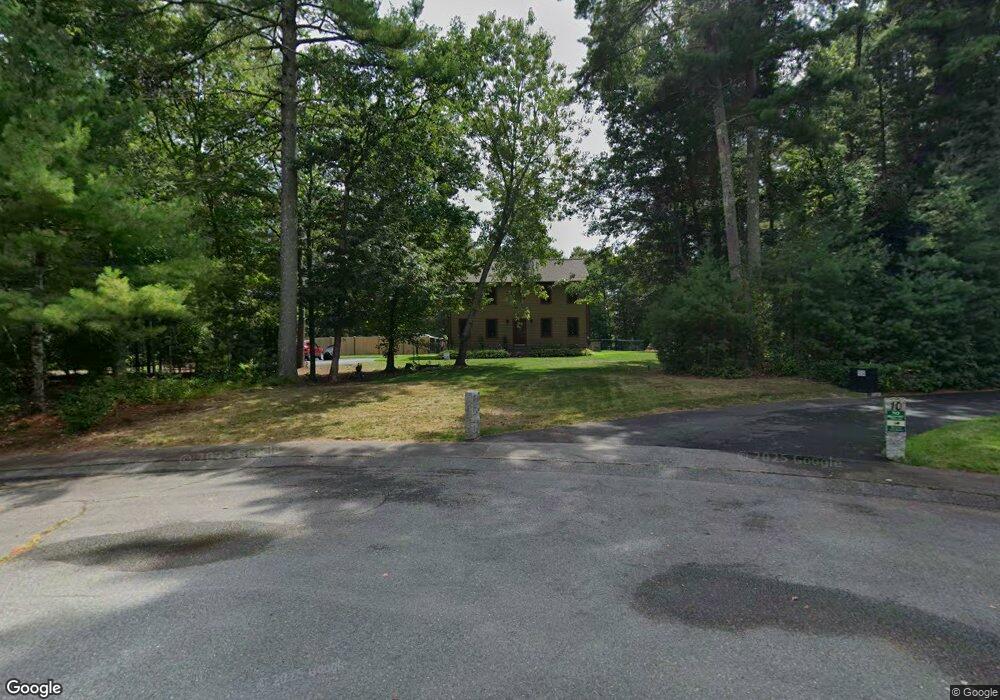
8 Egypt Rd Carver, MA 02330
Estimated Value: $665,000 - $770,000
4
Beds
3
Baths
2,390
Sq Ft
$303/Sq Ft
Est. Value
About This Home
This home is located at 8 Egypt Rd, Carver, MA 02330 and is currently estimated at $723,405, approximately $302 per square foot. 8 Egypt Rd is a home located in Plymouth County with nearby schools including Carver Elementary School, Carver Middle/High School, and Samuel Fuller School.
Ownership History
Date
Name
Owned For
Owner Type
Purchase Details
Closed on
Nov 1, 1994
Sold by
Prime Plus Rt and Gordon Barry J
Bought by
Sullivan Daniel H and Sullivan Denise M
Current Estimated Value
Purchase Details
Closed on
Jul 7, 1992
Sold by
Larsen Grace E
Bought by
Kinan Norman L and Kinan Margaret A
Create a Home Valuation Report for This Property
The Home Valuation Report is an in-depth analysis detailing your home's value as well as a comparison with similar homes in the area
Home Values in the Area
Average Home Value in this Area
Purchase History
| Date | Buyer | Sale Price | Title Company |
|---|---|---|---|
| Sullivan Daniel H | $164,000 | -- | |
| Kinan Norman L | $159,900 | -- |
Source: Public Records
Mortgage History
| Date | Status | Borrower | Loan Amount |
|---|---|---|---|
| Open | Kinan Norman L | $25,000 | |
| Open | Kinan Norman L | $95,000 | |
| Closed | Kinan Norman L | $25,000 |
Source: Public Records
Tax History
| Year | Tax Paid | Tax Assessment Tax Assessment Total Assessment is a certain percentage of the fair market value that is determined by local assessors to be the total taxable value of land and additions on the property. | Land | Improvement |
|---|---|---|---|---|
| 2025 | $8,529 | $614,900 | $164,300 | $450,600 |
| 2024 | $8,039 | $567,300 | $161,000 | $406,300 |
| 2023 | $7,804 | $534,900 | $161,000 | $373,900 |
| 2022 | $7,378 | $461,700 | $137,700 | $324,000 |
| 2021 | $7,321 | $432,200 | $123,000 | $309,200 |
| 2020 | $6,981 | $406,100 | $114,900 | $291,200 |
| 2019 | $6,794 | $398,500 | $111,500 | $287,000 |
| 2018 | $6,542 | $371,100 | $111,500 | $259,600 |
| 2017 | $6,319 | $357,200 | $107,300 | $249,900 |
| 2016 | $5,817 | $341,600 | $102,200 | $239,400 |
| 2015 | $5,693 | $334,700 | $102,200 | $232,500 |
| 2014 | $5,511 | $324,000 | $129,200 | $194,800 |
Source: Public Records
Map
Nearby Homes
Your Personal Tour Guide
Ask me questions while you tour the home.