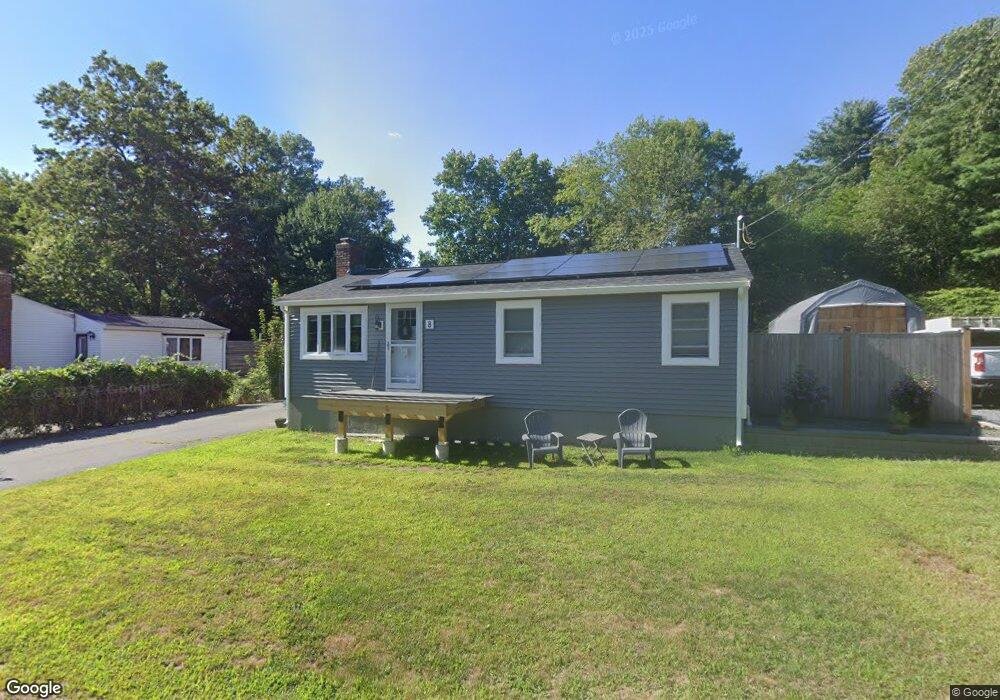
8 Evan Rd Pembroke, MA 02359
Estimated Value: $483,000 - $519,000
2
Beds
1
Bath
1,132
Sq Ft
$444/Sq Ft
Est. Value
About This Home
This home is located at 8 Evan Rd, Pembroke, MA 02359 and is currently estimated at $502,261, approximately $443 per square foot. 8 Evan Rd is a home with nearby schools including Pembroke High School.
Ownership History
Date
Name
Owned For
Owner Type
Purchase Details
Closed on
Oct 19, 2016
Sold by
Dow Michael A and Mulvaney Annelise M
Bought by
Dow Michael A
Current Estimated Value
Purchase Details
Closed on
Jun 22, 2006
Sold by
Dow Michael A
Bought by
Dow Michael A and Doe Annelise M
Purchase Details
Closed on
Dec 29, 2000
Sold by
Manning Mary L
Bought by
Carman Brendan J and Carman Carolyn M
Create a Home Valuation Report for This Property
The Home Valuation Report is an in-depth analysis detailing your home's value as well as a comparison with similar homes in the area
Home Values in the Area
Average Home Value in this Area
Purchase History
| Date | Buyer | Sale Price | Title Company |
|---|---|---|---|
| Dow Michael A | -- | -- | |
| Dow Michael A | -- | -- | |
| Dow Michael A | $304,900 | -- | |
| Carman Brendan J | $180,000 | -- |
Source: Public Records
Mortgage History
| Date | Status | Borrower | Loan Amount |
|---|---|---|---|
| Previous Owner | Carman Brendan J | $62,000 | |
| Previous Owner | Carman Brendan J | $245,000 |
Source: Public Records
Tax History Compared to Growth
Tax History
| Year | Tax Paid | Tax Assessment Tax Assessment Total Assessment is a certain percentage of the fair market value that is determined by local assessors to be the total taxable value of land and additions on the property. | Land | Improvement |
|---|---|---|---|---|
| 2025 | $4,928 | $410,000 | $246,500 | $163,500 |
| 2024 | $4,601 | $382,500 | $220,400 | $162,100 |
| 2023 | $4,708 | $370,100 | $220,400 | $149,700 |
| 2022 | $4,374 | $309,100 | $180,300 | $128,800 |
| 2021 | $4,198 | $287,900 | $172,000 | $115,900 |
| 2020 | $4,073 | $281,100 | $164,300 | $116,800 |
| 2019 | $3,942 | $270,000 | $160,100 | $109,900 |
| 2018 | $3,842 | $258,000 | $140,900 | $117,100 |
| 2017 | $3,795 | $251,300 | $133,300 | $118,000 |
| 2016 | $3,733 | $244,600 | $125,700 | $118,900 |
| 2015 | $3,451 | $234,100 | $114,100 | $120,000 |
Source: Public Records
Map
Nearby Homes