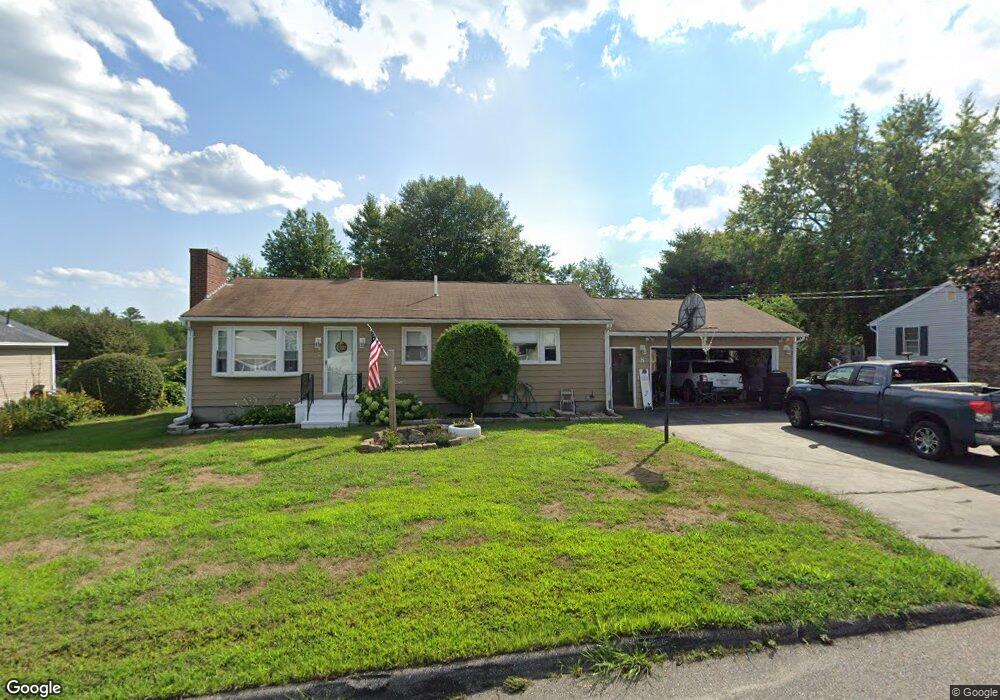
8 Evanthia Dr Biddeford, ME 04005
South Biddeford NeighborhoodEstimated Value: $393,000 - $441,000
2
Beds
1
Bath
1,008
Sq Ft
$406/Sq Ft
Est. Value
About This Home
This home is located at 8 Evanthia Dr, Biddeford, ME 04005 and is currently estimated at $409,043, approximately $405 per square foot. 8 Evanthia Dr is a home located in York County with nearby schools including John F Kennedy Memorial School, Biddeford Primary School, and Biddeford Intermediate School.
Ownership History
Date
Name
Owned For
Owner Type
Purchase Details
Closed on
Sep 24, 2013
Sold by
Cantara Juliette V Est and Cantara Roger P
Bought by
Cantara Linda M and Cantara John F
Current Estimated Value
Home Financials for this Owner
Home Financials are based on the most recent Mortgage that was taken out on this home.
Original Mortgage
$168,367
Interest Rate
4.42%
Mortgage Type
New Conventional
Create a Home Valuation Report for This Property
The Home Valuation Report is an in-depth analysis detailing your home's value as well as a comparison with similar homes in the area
Home Values in the Area
Average Home Value in this Area
Purchase History
| Date | Buyer | Sale Price | Title Company |
|---|---|---|---|
| Cantara Linda M | -- | -- |
Source: Public Records
Mortgage History
| Date | Status | Borrower | Loan Amount |
|---|---|---|---|
| Closed | Cantara Linda M | $168,367 |
Source: Public Records
Tax History
| Year | Tax Paid | Tax Assessment Tax Assessment Total Assessment is a certain percentage of the fair market value that is determined by local assessors to be the total taxable value of land and additions on the property. | Land | Improvement |
|---|---|---|---|---|
| 2024 | $4,558 | $320,500 | $158,700 | $161,800 |
| 2023 | $4,171 | $317,900 | $156,100 | $161,800 |
| 2022 | $3,730 | $227,300 | $83,100 | $144,200 |
| 2021 | $3,097 | $194,900 | $71,600 | $123,300 |
| 2020 | $4,293 | $173,900 | $60,400 | $113,500 |
| 2019 | $4,235 | $172,400 | $60,400 | $112,000 |
| 2018 | $3,396 | $172,400 | $60,400 | $112,000 |
| 2017 | $4,016 | $157,100 | $60,400 | $96,700 |
| 2016 | $3,112 | $156,700 | $60,400 | $96,300 |
| 2015 | $3,051 | $156,700 | $60,400 | $96,300 |
| 2014 | $2,976 | $156,700 | $60,400 | $96,300 |
| 2013 | -- | $173,600 | $68,500 | $105,100 |
Source: Public Records
Map
Nearby Homes
Your Personal Tour Guide
Ask me questions while you tour the home.