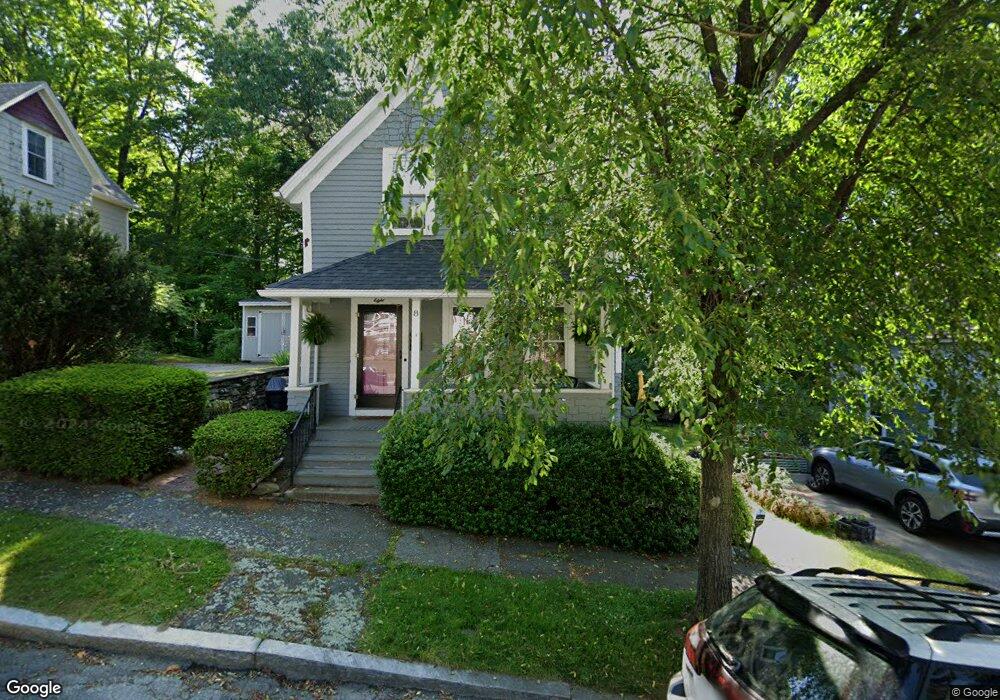
8 Farnum St Worcester, MA 01602
Salisbury Street NeighborhoodEstimated Value: $363,000 - $444,000
3
Beds
2
Baths
1,531
Sq Ft
$263/Sq Ft
Est. Value
About This Home
This home is located at 8 Farnum St, Worcester, MA 01602 and is currently estimated at $403,171, approximately $263 per square foot. 8 Farnum St is a home located in Worcester County with nearby schools including Jacob Hiatt Magnet School, Chandler Magnet, and Flagg Street School.
Ownership History
Date
Name
Owned For
Owner Type
Purchase Details
Closed on
Jun 11, 2024
Sold by
Foley Patricia A
Bought by
Godbey & Foley Ret and Foley
Current Estimated Value
Purchase Details
Closed on
Aug 17, 2007
Sold by
Foley Patricia A
Bought by
Foley Patricia A
Create a Home Valuation Report for This Property
The Home Valuation Report is an in-depth analysis detailing your home's value as well as a comparison with similar homes in the area
Home Values in the Area
Average Home Value in this Area
Purchase History
| Date | Buyer | Sale Price | Title Company |
|---|---|---|---|
| Godbey & Foley Ret | -- | None Available | |
| Godbey & Foley Ret | -- | None Available | |
| Foley Patricia A | -- | -- | |
| Foley Patricia A | -- | -- |
Source: Public Records
Mortgage History
| Date | Status | Borrower | Loan Amount |
|---|---|---|---|
| Previous Owner | Foley Patricia A | $26,000 | |
| Previous Owner | Foley Patricia A | $15,000 |
Source: Public Records
Tax History Compared to Growth
Tax History
| Year | Tax Paid | Tax Assessment Tax Assessment Total Assessment is a certain percentage of the fair market value that is determined by local assessors to be the total taxable value of land and additions on the property. | Land | Improvement |
|---|---|---|---|---|
| 2025 | $4,011 | $304,100 | $81,700 | $222,400 |
| 2024 | $3,823 | $278,000 | $81,700 | $196,300 |
| 2023 | $3,680 | $256,600 | $71,000 | $185,600 |
| 2022 | $3,399 | $223,500 | $56,800 | $166,700 |
| 2021 | $3,970 | $204,700 | $45,500 | $159,200 |
| 2020 | $3,157 | $185,700 | $45,500 | $140,200 |
| 2019 | $3,031 | $168,400 | $40,900 | $127,500 |
| 2018 | $3,494 | $159,200 | $40,900 | $118,300 |
| 2017 | $3,793 | $149,400 | $40,900 | $108,500 |
| 2016 | $2,898 | $140,600 | $31,100 | $109,500 |
| 2015 | $2,822 | $140,600 | $31,100 | $109,500 |
| 2014 | $2,747 | $140,600 | $31,100 | $109,500 |
Source: Public Records
Map
Nearby Homes
- 6 Farnum St
- 10 Farnum St
- 2 Farnum Terrace
- 4 Farnum St
- 1 Farnum Terrace
- 3 Mount Hope Terrace
- 7 Mount Hope Terrace
- 4 Farnum Terrace
- 3 Farnum Terrace
- 15 Farnum St
- 162 Institute Rd
- 6 Farnum Terrace
- 160 Institute Rd
- 168 Institute Rd
- 5 Farnum Terrace
- 19 Farnum St
- 4 Mount Hope Terrace
- 172 Institute Rd
- 10 Mount Hope Terrace
- 2 Mount Hope Terrace