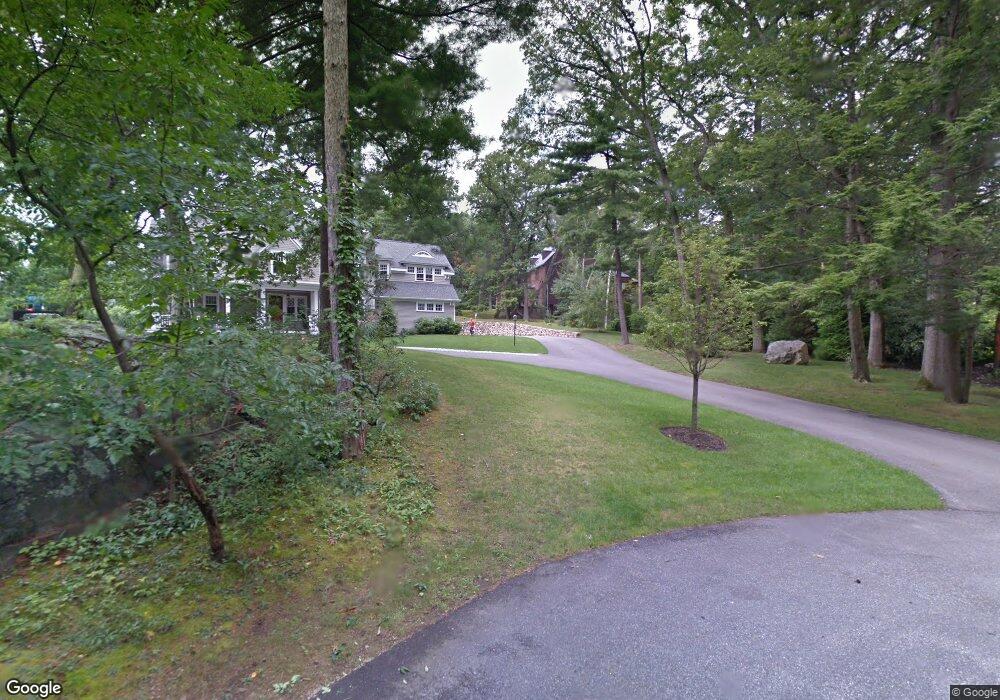
8 Fernway Winchester, MA 01890
Estimated Value: $2,533,000 - $2,613,000
4
Beds
5
Baths
4,530
Sq Ft
$568/Sq Ft
Est. Value
About This Home
This home is located at 8 Fernway, Winchester, MA 01890 and is currently estimated at $2,571,377, approximately $567 per square foot. 8 Fernway is a home located in Middlesex County with nearby schools including Ambrose Elementary School, McCall Middle School, and Winchester High School.
Ownership History
Date
Name
Owned For
Owner Type
Purchase Details
Closed on
May 31, 2024
Sold by
Obrien Elise and Obrien Andrea
Bought by
White Wharf Llc
Current Estimated Value
Purchase Details
Closed on
Sep 1, 2016
Sold by
Elise B Obrien Ret
Bought by
Obrien Elise and Obrien Adrienne
Purchase Details
Closed on
Oct 22, 2008
Sold by
Obrien Adrienne and Obrien Andrea
Bought by
Obrien Tr Andrea and Obrien Andrienne
Create a Home Valuation Report for This Property
The Home Valuation Report is an in-depth analysis detailing your home's value as well as a comparison with similar homes in the area
Home Values in the Area
Average Home Value in this Area
Purchase History
| Date | Buyer | Sale Price | Title Company |
|---|---|---|---|
| White Wharf Llc | -- | None Available | |
| White Wharf Llc | -- | None Available | |
| Obrien Elise | -- | -- | |
| Obrien Tr Andrea | -- | -- | |
| Obrien Elise | -- | -- | |
| Obrien Tr Andrea | -- | -- |
Source: Public Records
Tax History Compared to Growth
Tax History
| Year | Tax Paid | Tax Assessment Tax Assessment Total Assessment is a certain percentage of the fair market value that is determined by local assessors to be the total taxable value of land and additions on the property. | Land | Improvement |
|---|---|---|---|---|
| 2025 | $255 | $2,295,600 | $1,334,700 | $960,900 |
| 2024 | $25,985 | $2,293,500 | $1,334,700 | $958,800 |
| 2023 | $25,100 | $2,127,100 | $1,254,700 | $872,400 |
| 2022 | $24,376 | $1,948,500 | $1,133,400 | $815,100 |
| 2021 | $23,203 | $1,808,500 | $993,400 | $815,100 |
| 2020 | $22,407 | $1,808,500 | $993,400 | $815,100 |
| 2019 | $20,811 | $1,718,500 | $903,400 | $815,100 |
| 2018 | $4,835 | $1,648,400 | $887,400 | $761,000 |
| 2017 | $20,241 | $1,648,300 | $887,400 | $760,900 |
| 2016 | $18,917 | $1,619,600 | $887,400 | $732,200 |
| 2015 | $17,995 | $1,482,300 | $807,400 | $674,900 |
| 2014 | $17,851 | $1,410,000 | $735,400 | $674,600 |
Source: Public Records
Map
Nearby Homes