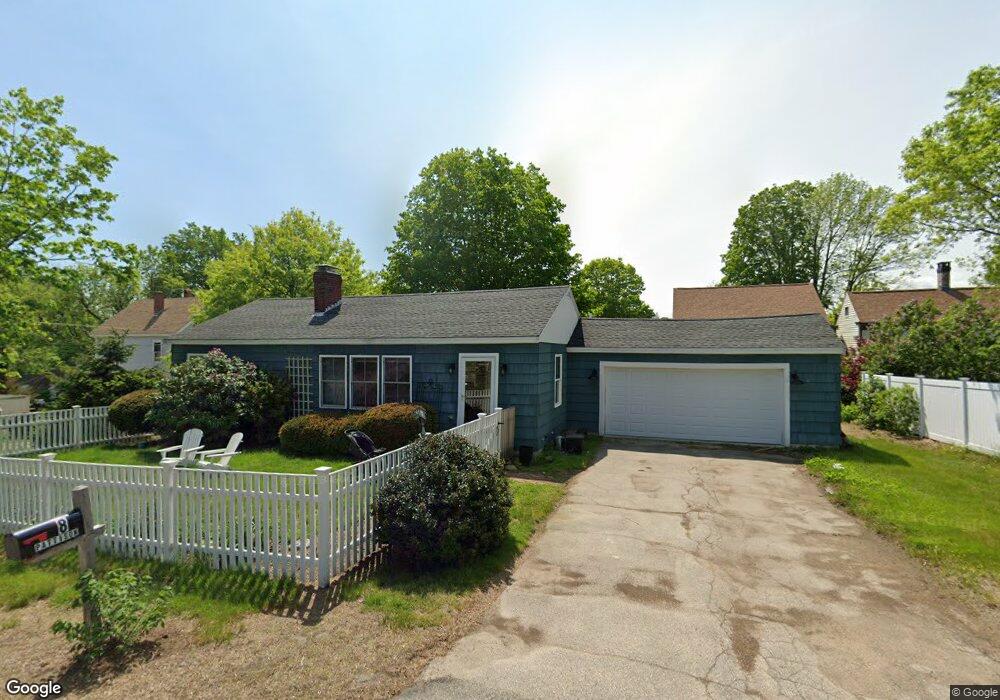
8 First St Berwick, ME 03901
Estimated Value: $345,000 - $378,952
2
Beds
1
Bath
960
Sq Ft
$380/Sq Ft
Est. Value
About This Home
This home is located at 8 First St, Berwick, ME 03901 and is currently estimated at $364,488, approximately $379 per square foot. 8 First St is a home located in York County with nearby schools including Noble High School and Tri-City Christian Academy.
Ownership History
Date
Name
Owned For
Owner Type
Purchase Details
Closed on
May 26, 2022
Sold by
Pattison Elisabeth R
Bought by
Comeau-Pohli Hannah and Comeau-Mccaffrey Julia
Current Estimated Value
Purchase Details
Closed on
Jun 7, 2019
Sold by
Galleshaw Serena C
Bought by
Pattison Elisabeth R
Home Financials for this Owner
Home Financials are based on the most recent Mortgage that was taken out on this home.
Original Mortgage
$170,000
Interest Rate
4.2%
Mortgage Type
New Conventional
Purchase Details
Closed on
Jun 4, 2019
Sold by
Galleshaw Rebecca L Est and Smith
Bought by
Galleshaw Serena C
Home Financials for this Owner
Home Financials are based on the most recent Mortgage that was taken out on this home.
Original Mortgage
$170,000
Interest Rate
4.2%
Mortgage Type
New Conventional
Purchase Details
Closed on
Sep 10, 2014
Sold by
Galleshaw Rebecca L Est and Smith
Bought by
Galleshaw Serena C
Create a Home Valuation Report for This Property
The Home Valuation Report is an in-depth analysis detailing your home's value as well as a comparison with similar homes in the area
Home Values in the Area
Average Home Value in this Area
Purchase History
| Date | Buyer | Sale Price | Title Company |
|---|---|---|---|
| Comeau-Pohli Hannah | -- | None Available | |
| Comeau-Pohli Hannah | -- | None Available | |
| Comeau-Pohli Hannah | -- | None Available | |
| Pattison Elisabeth R | -- | -- | |
| Pattison Elisabeth R | -- | -- | |
| Pattison Elisabeth R | -- | -- | |
| Galleshaw Serena C | -- | -- | |
| Galleshaw Serena C | -- | -- | |
| Galleshaw Serena C | -- | -- | |
| Galleshaw Serena C | -- | -- | |
| Galleshaw Serena C | -- | -- |
Source: Public Records
Mortgage History
| Date | Status | Borrower | Loan Amount |
|---|---|---|---|
| Previous Owner | Pattison Elisabeth R | $170,000 |
Source: Public Records
Tax History
| Year | Tax Paid | Tax Assessment Tax Assessment Total Assessment is a certain percentage of the fair market value that is determined by local assessors to be the total taxable value of land and additions on the property. | Land | Improvement |
|---|---|---|---|---|
| 2025 | $3,997 | $306,500 | $106,600 | $199,900 |
| 2024 | $3,822 | $306,500 | $106,600 | $199,900 |
| 2023 | $3,122 | $170,400 | $76,200 | $94,200 |
| 2022 | $3,105 | $170,400 | $76,200 | $94,200 |
| 2021 | $3,118 | $170,400 | $76,200 | $94,200 |
| 2020 | $2,991 | $170,400 | $76,200 | $94,200 |
| 2019 | $2,991 | $170,600 | $76,200 | $94,400 |
| 2018 | $2,718 | $158,500 | $69,900 | $88,600 |
| 2017 | $2,718 | $158,500 | $69,900 | $88,600 |
| 2016 | $2,584 | $158,500 | $69,900 | $88,600 |
| 2014 | $2,457 | $154,500 | $69,900 | $84,600 |
| 2013 | $2,501 | $155,800 | $69,900 | $85,900 |
Source: Public Records
Map
Nearby Homes
- 8 1st St
- 48 Sawmill Hill
- 46 Sawmill Hill
- 46 Sawmill Hill Unit 2
- 46 Saw Mill Hill
- 38 Moulton St
- 12 First St
- 56 Sawmill Hill
- 44 Moulton St
- 34 Moulton St
- 53 Sawmill Hill
- 44 Saw Mill Hill
- 44 Saw Mill Hill Rd
- 13 First St
- 67 Sawmill Hill
- 67 Saw Mill Hill
- 29 Moulton St
- 44 Sawmill Hill
- 30 Moulton St
- 16 First St
Your Personal Tour Guide
Ask me questions while you tour the home.