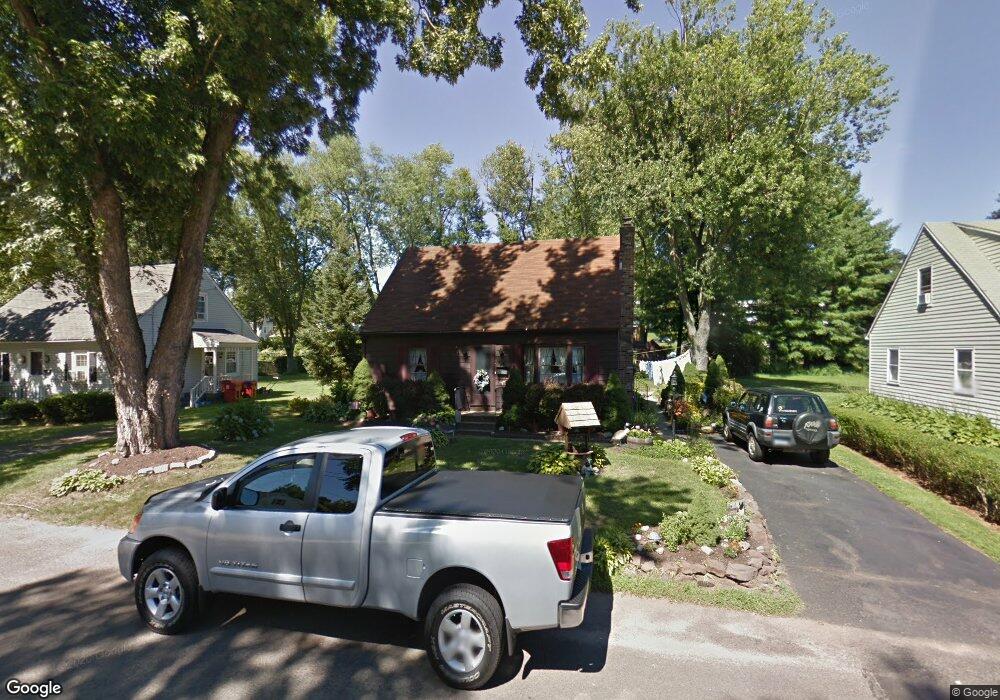
8 Foley Rd Portland, CT 06480
Estimated Value: $284,210 - $328,000
2
Beds
1
Bath
1,172
Sq Ft
$257/Sq Ft
Est. Value
About This Home
This home is located at 8 Foley Rd, Portland, CT 06480 and is currently estimated at $301,053, approximately $256 per square foot. 8 Foley Rd is a home located in Middlesex County with nearby schools including Valley View School, Brownstone Intermediate School, and Gildersleeve School.
Ownership History
Date
Name
Owned For
Owner Type
Purchase Details
Closed on
Aug 8, 2014
Sold by
Backman Millicent J
Bought by
Backman Kevin
Current Estimated Value
Home Financials for this Owner
Home Financials are based on the most recent Mortgage that was taken out on this home.
Original Mortgage
$90,000
Outstanding Balance
$49,028
Interest Rate
4.18%
Estimated Equity
$252,025
Purchase Details
Closed on
Jan 11, 2012
Sold by
Backman Rodney B
Bought by
Backman Millicent J
Purchase Details
Closed on
Aug 6, 1999
Sold by
Marino Eileen G
Bought by
Gut Anna and Gut Janina
Create a Home Valuation Report for This Property
The Home Valuation Report is an in-depth analysis detailing your home's value as well as a comparison with similar homes in the area
Home Values in the Area
Average Home Value in this Area
Purchase History
| Date | Buyer | Sale Price | Title Company |
|---|---|---|---|
| Backman Kevin | -- | -- | |
| Backman Millicent J | -- | -- | |
| Gut Anna | $108,000 | -- |
Source: Public Records
Mortgage History
| Date | Status | Borrower | Loan Amount |
|---|---|---|---|
| Open | Gut Anna | $90,000 | |
| Previous Owner | Gut Anna | $50,000 |
Source: Public Records
Tax History
| Year | Tax Paid | Tax Assessment Tax Assessment Total Assessment is a certain percentage of the fair market value that is determined by local assessors to be the total taxable value of land and additions on the property. | Land | Improvement |
|---|---|---|---|---|
| 2025 | $4,631 | $131,180 | $51,100 | $80,080 |
| 2024 | $4,499 | $131,180 | $51,100 | $80,080 |
| 2023 | $4,258 | $131,180 | $51,100 | $80,080 |
| 2022 | $4,255 | $131,180 | $51,100 | $80,080 |
| 2021 | $3,779 | $107,940 | $46,480 | $61,460 |
| 2020 | $3,711 | $107,940 | $46,480 | $61,460 |
| 2019 | $3,649 | $107,940 | $46,480 | $61,460 |
| 2018 | $8,495 | $107,940 | $46,480 | $61,460 |
| 2017 | $3,560 | $107,940 | $46,480 | $61,460 |
| 2016 | $3,436 | $105,700 | $49,770 | $55,930 |
| 2015 | $3,418 | $105,700 | $49,770 | $55,930 |
| 2014 | $3,359 | $105,700 | $49,770 | $55,930 |
Source: Public Records
Map
Nearby Homes
- 11 Foley Rd
- 14 Church St
- 24 Saint Johns St
- 54 Washington St
- 28 & 33 River Rd
- 480 Main St
- 9 Pear Orchard Rd
- 548 Main St
- 41 Spring St
- 111 Dekoven Dr Unit 1105
- 111 Dekoven Dr Unit 506
- 25 Clinton Ave
- 207 Pearl St
- 177 Pearl St
- 8 Macdonough Place
- 565 High St
- 132 Grand St
- 146 Liberty St
- 1263, 1306, 1316, 13 Pecausett Meadows
- 242 Summer St
Your Personal Tour Guide
Ask me questions while you tour the home.