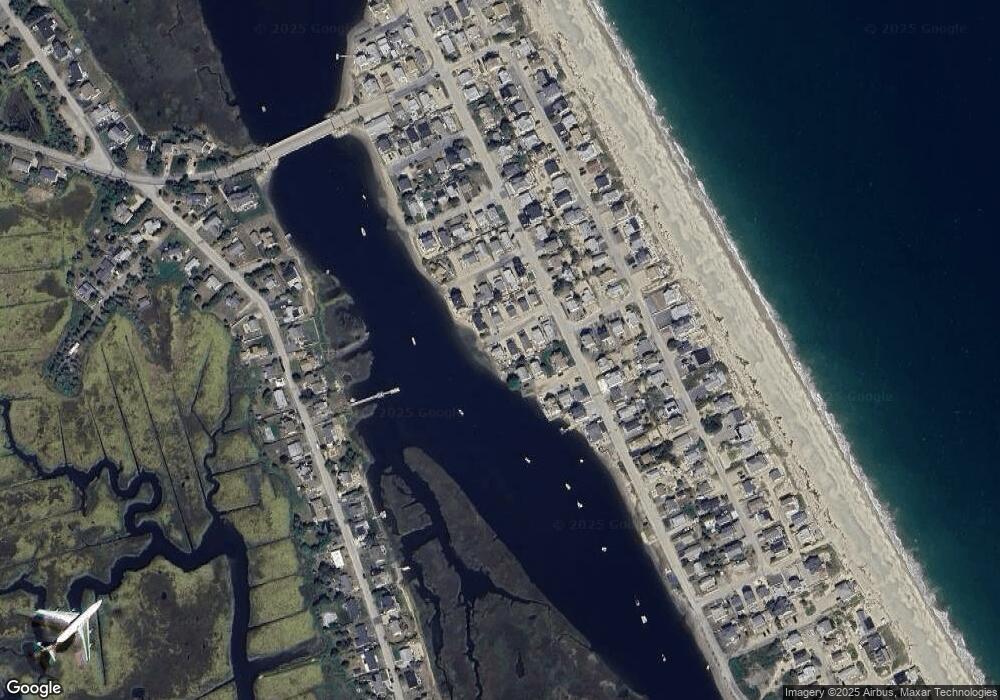
8 Franklin St Scituate, MA 02066
Humarock NeighborhoodEstimated Value: $691,000 - $974,000
2
Beds
2
Baths
1,008
Sq Ft
$801/Sq Ft
Est. Value
About This Home
This home is located at 8 Franklin St, Scituate, MA 02066 and is currently estimated at $807,667, approximately $801 per square foot. 8 Franklin St is a home.
Ownership History
Date
Name
Owned For
Owner Type
Purchase Details
Closed on
Aug 5, 2019
Sold by
Gillespie Richard W
Bought by
Gillwspine 2019 T
Current Estimated Value
Purchase Details
Closed on
Dec 31, 1996
Sold by
Doyle Susan
Bought by
Gillespie Richard W
Home Financials for this Owner
Home Financials are based on the most recent Mortgage that was taken out on this home.
Original Mortgage
$15,000
Interest Rate
7.55%
Mortgage Type
Purchase Money Mortgage
Purchase Details
Closed on
Jul 3, 1996
Sold by
Macarthur Janice C
Bought by
Gillespie Richard W
Home Financials for this Owner
Home Financials are based on the most recent Mortgage that was taken out on this home.
Original Mortgage
$15,000
Interest Rate
7.98%
Mortgage Type
Purchase Money Mortgage
Create a Home Valuation Report for This Property
The Home Valuation Report is an in-depth analysis detailing your home's value as well as a comparison with similar homes in the area
Home Values in the Area
Average Home Value in this Area
Purchase History
| Date | Buyer | Sale Price | Title Company |
|---|---|---|---|
| Gillwspine 2019 T | -- | -- | |
| Gillespie Richard W | $30,000 | -- | |
| Gillespie Richard W | $30,000 | -- |
Source: Public Records
Mortgage History
| Date | Status | Borrower | Loan Amount |
|---|---|---|---|
| Previous Owner | Gillespie Richard W | $15,000 | |
| Previous Owner | Gillespie Richard W | $15,000 |
Source: Public Records
Tax History Compared to Growth
Tax History
| Year | Tax Paid | Tax Assessment Tax Assessment Total Assessment is a certain percentage of the fair market value that is determined by local assessors to be the total taxable value of land and additions on the property. | Land | Improvement |
|---|---|---|---|---|
| 2025 | $7,545 | $755,300 | $588,000 | $167,300 |
| 2024 | $6,237 | $602,000 | $500,000 | $102,000 |
| 2023 | $5,732 | $554,200 | $454,600 | $99,600 |
| 2022 | $5,732 | $454,200 | $366,500 | $87,700 |
| 2021 | $5,720 | $429,100 | $349,000 | $80,100 |
| 2020 | $5,762 | $426,800 | $347,100 | $79,700 |
| 2019 | $5,753 | $418,700 | $340,300 | $78,400 |
| 2018 | $5,954 | $426,800 | $351,500 | $75,300 |
| 2017 | $5,970 | $423,700 | $351,500 | $72,200 |
| 2016 | $5,854 | $414,000 | $341,800 | $72,200 |
| 2015 | $5,423 | $414,000 | $341,800 | $72,200 |
Source: Public Records
Map
Nearby Homes