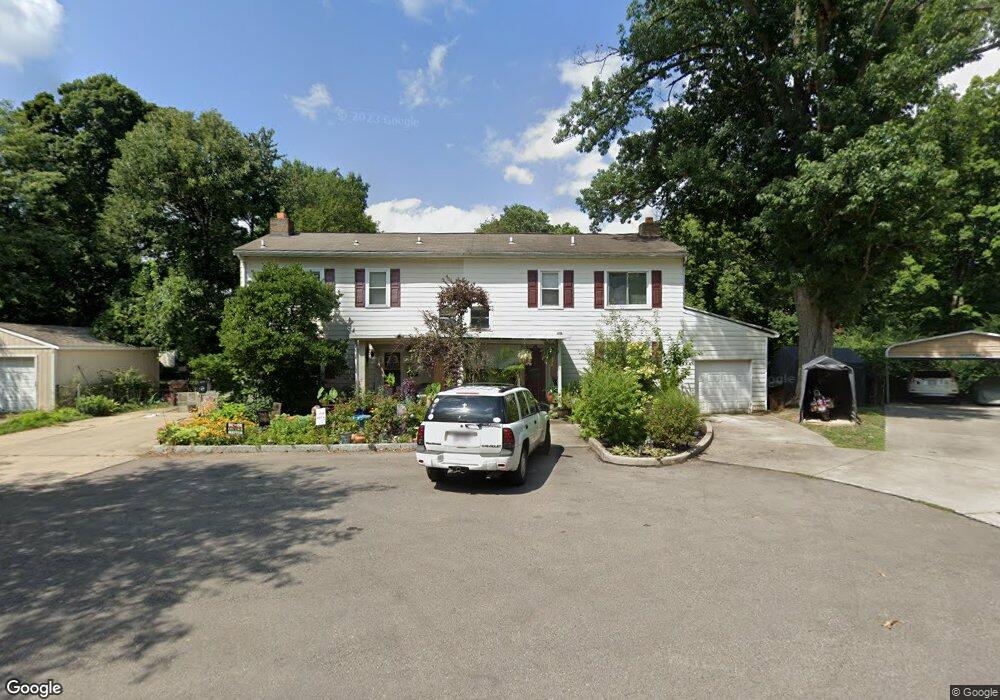
8 Funston Ln Cincinnati, OH 45218
Estimated Value: $133,000 - $179,213
3
Beds
3
Baths
1,430
Sq Ft
$108/Sq Ft
Est. Value
About This Home
This home is located at 8 Funston Ln, Cincinnati, OH 45218 and is currently estimated at $154,053, approximately $107 per square foot. 8 Funston Ln is a home located in Hamilton County with nearby schools including Central Montessori Academy and John Paul II Catholic School.
Ownership History
Date
Name
Owned For
Owner Type
Purchase Details
Closed on
Jan 25, 2011
Sold by
Fannie Mae
Bought by
Sirk Larry
Current Estimated Value
Purchase Details
Closed on
Mar 1, 2010
Sold by
Patterson Deanna
Bought by
Fanniemae and Federal National Mortgage Association
Purchase Details
Closed on
Aug 31, 2000
Sold by
Marilyn Slotkin
Bought by
Patterson Deanna
Home Financials for this Owner
Home Financials are based on the most recent Mortgage that was taken out on this home.
Original Mortgage
$71,725
Interest Rate
8.15%
Create a Home Valuation Report for This Property
The Home Valuation Report is an in-depth analysis detailing your home's value as well as a comparison with similar homes in the area
Home Values in the Area
Average Home Value in this Area
Purchase History
| Date | Buyer | Sale Price | Title Company |
|---|---|---|---|
| Sirk Larry | $22,500 | Attorney | |
| Fanniemae | $56,000 | Attorney | |
| Patterson Deanna | $75,500 | -- |
Source: Public Records
Mortgage History
| Date | Status | Borrower | Loan Amount |
|---|---|---|---|
| Previous Owner | Patterson Deanna | $71,725 |
Source: Public Records
Tax History
| Year | Tax Paid | Tax Assessment Tax Assessment Total Assessment is a certain percentage of the fair market value that is determined by local assessors to be the total taxable value of land and additions on the property. | Land | Improvement |
|---|---|---|---|---|
| 2025 | $3,133 | $42,308 | $10,255 | $32,053 |
| 2024 | $2,970 | $42,308 | $10,255 | $32,053 |
| 2023 | $2,729 | $42,308 | $10,255 | $32,053 |
| 2022 | $2,495 | $28,928 | $8,558 | $20,370 |
| 2021 | $2,495 | $28,928 | $8,558 | $20,370 |
| 2020 | $2,467 | $28,928 | $8,558 | $20,370 |
| 2019 | $2,411 | $24,724 | $7,315 | $17,409 |
| 2018 | $2,414 | $24,724 | $7,315 | $17,409 |
| 2017 | $2,272 | $24,724 | $7,315 | $17,409 |
| 2016 | $741 | $7,637 | $7,203 | $434 |
| 2015 | $689 | $7,637 | $7,203 | $434 |
| 2014 | $704 | $7,637 | $7,203 | $434 |
| 2013 | $703 | $7,875 | $7,427 | $448 |
Source: Public Records
Map
Nearby Homes
- 34 Gambier Cir
- 37 Hayden Dr
- 6 Chalmers Ct
- 11 Ashby St
- 38 Handel Ln
- 1013 Ligorio Ave
- 16 Japonica Dr
- 11 Dewitt Ct
- 6 Belknap Place 1
- 9 Dewitt Ct
- 7 Dewitt Ct
- 23 Briarwood Ln
- 10022 Lakeside Dr
- 564 Waycross Rd
- 778 Danbury Rd
- 9876 Lorelei Dr
- 602 Brightview Place
- 602 Brightview Place Unit 34
- 683 Danbury Rd
- 946 Mckelvey Rd
Your Personal Tour Guide
Ask me questions while you tour the home.