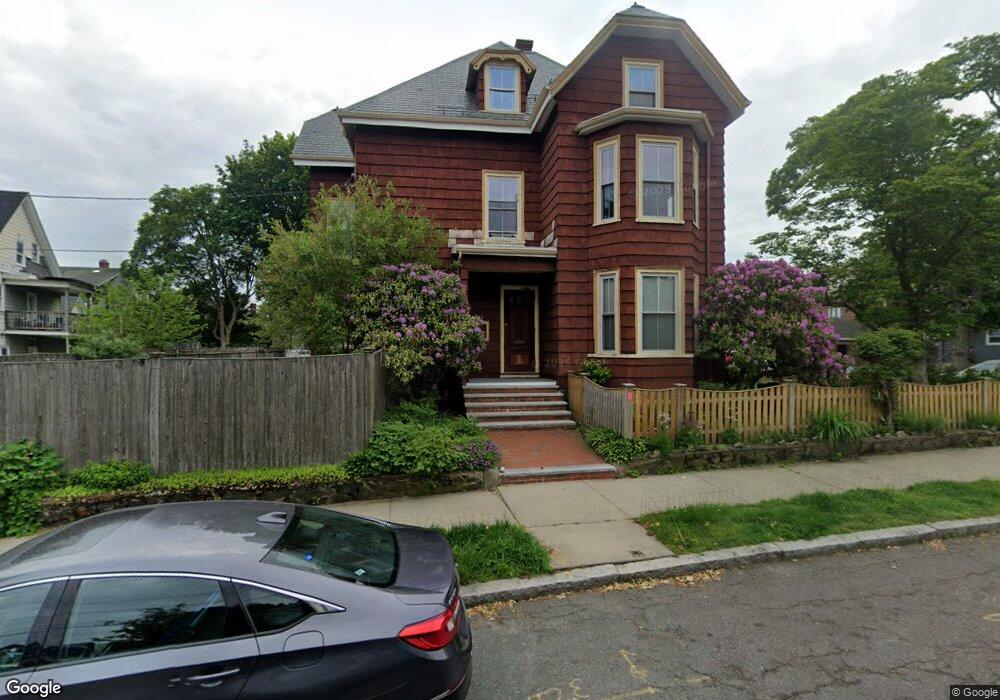
8 Garland St Unit 2 Lynn, MA 01902
Diamond District NeighborhoodEstimated Value: $353,541 - $526,000
2
Beds
1
Bath
1,350
Sq Ft
$310/Sq Ft
Est. Value
About This Home
This home is located at 8 Garland St Unit 2, Lynn, MA 01902 and is currently estimated at $418,385, approximately $309 per square foot. 8 Garland St Unit 2 is a home located in Essex County with nearby schools including Brickett Elementary School, William R. Fallon School, and Marshall Middle School.
Ownership History
Date
Name
Owned For
Owner Type
Purchase Details
Closed on
Jun 27, 2003
Sold by
Levangia Timothy J
Bought by
Levangia Timothy J
Current Estimated Value
Purchase Details
Closed on
Jun 21, 1993
Sold by
Fnma
Bought by
Levangia Timothy
Home Financials for this Owner
Home Financials are based on the most recent Mortgage that was taken out on this home.
Original Mortgage
$36,950
Interest Rate
7.38%
Mortgage Type
Purchase Money Mortgage
Purchase Details
Closed on
Mar 21, 1993
Sold by
Coleman Kathleen F
Bought by
Farragut Mtg Co Inc
Purchase Details
Closed on
Mar 12, 1993
Sold by
Farragut Mtg Co Inc
Bought by
Federal National Mortgage Association
Create a Home Valuation Report for This Property
The Home Valuation Report is an in-depth analysis detailing your home's value as well as a comparison with similar homes in the area
Home Values in the Area
Average Home Value in this Area
Purchase History
| Date | Buyer | Sale Price | Title Company |
|---|---|---|---|
| Levangia Timothy J | -- | -- | |
| Levangia Timothy J | -- | -- | |
| Levangia Timothy | $38,900 | -- | |
| Levangia Timothy | $38,900 | -- | |
| Farragut Mtg Co Inc | $108,103 | -- | |
| Farragut Mtg Co Inc | $108,103 | -- | |
| Federal National Mortgage Association | $108,103 | -- | |
| Federal National Mortgage Association | $108,103 | -- |
Source: Public Records
Mortgage History
| Date | Status | Borrower | Loan Amount |
|---|---|---|---|
| Open | Federal National Mortgage Association | $75,000 | |
| Previous Owner | Federal National Mortgage Association | $36,950 |
Source: Public Records
Tax History Compared to Growth
Tax History
| Year | Tax Paid | Tax Assessment Tax Assessment Total Assessment is a certain percentage of the fair market value that is determined by local assessors to be the total taxable value of land and additions on the property. | Land | Improvement |
|---|---|---|---|---|
| 2025 | $2,878 | $277,800 | $0 | $277,800 |
| 2024 | $2,760 | $262,100 | $0 | $262,100 |
| 2023 | $2,715 | $243,500 | $0 | $243,500 |
| 2022 | $2,737 | $220,200 | $0 | $220,200 |
| 2021 | $2,727 | $209,300 | $0 | $209,300 |
| 2020 | $2,642 | $197,200 | $0 | $197,200 |
| 2019 | $2,620 | $183,200 | $0 | $183,200 |
| 2018 | $2,432 | $174,300 | $0 | $174,300 |
| 2017 | $2,429 | $155,700 | $0 | $155,700 |
| 2016 | $2,416 | $149,300 | $0 | $149,300 |
| 2015 | $2,223 | $132,700 | $0 | $132,700 |
Source: Public Records
Map
Nearby Homes
- 42 Basset St
- 38 Cherry St Unit 1
- 2 Peirce Rd
- 46 Wardwell Ave
- 38 Chestnut St
- 7 Sidney Ave
- 13 Portland St Unit 4
- 285 Lynn Shore Dr Unit 308
- 285 Lynn Shore Dr Unit 508
- 285 Lynn Shore Dr Unit 203
- 24 Parrott St
- 300 Lynn Shore Dr Unit 612
- 14-16 Dexter St
- 95 Nahant St Unit 12
- 95 Nahant St Unit 33
- 26 Groveland St
- 13 Nahant St Unit 2D
- 13 Nahant St Unit 4A
- 13 Nahant St Unit 3A
- 13 Nahant St Unit 4C
- 8 Garland St Unit 3
- 8 Garland St Unit 1
- 8 Red Rock St
- 2 Garland St
- 25 Bassett St
- 10 Red Rock St
- 25 Basset St Unit 1
- 16 Garland St Unit 3
- 16 Garland St Unit 2
- 16 Garland St Unit 1
- 29 Bassett St
- 12 Red Rock St
- 12 Red Rock St Unit 1
- 3 Garland St
- 9 Garland St
- 17 Basset St
- 17 Bassett St
- 7 Garland St
- 37 Bassett St
- 20 Garland St