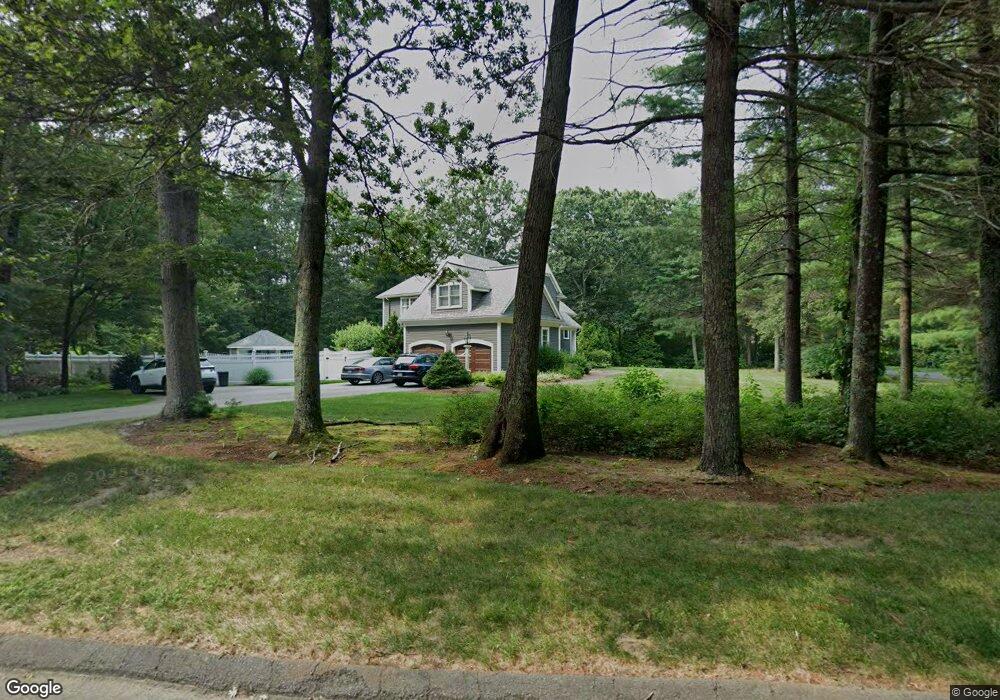
8 Gary Rd Foxboro, MA 02035
Estimated Value: $1,080,174 - $1,263,000
4
Beds
3
Baths
3,208
Sq Ft
$365/Sq Ft
Est. Value
About This Home
This home is located at 8 Gary Rd, Foxboro, MA 02035 and is currently estimated at $1,171,294, approximately $365 per square foot. 8 Gary Rd is a home located in Norfolk County with nearby schools including Foxborough High School, Foxborough Regional Charter School, and Hands-On-Montessori School.
Ownership History
Date
Name
Owned For
Owner Type
Purchase Details
Closed on
Jul 31, 2008
Sold by
Lane Rosemary J and Lane William B
Bought by
Peck Christopher E and Peck Michelle N
Current Estimated Value
Home Financials for this Owner
Home Financials are based on the most recent Mortgage that was taken out on this home.
Original Mortgage
$417,000
Interest Rate
6.47%
Mortgage Type
Purchase Money Mortgage
Purchase Details
Closed on
Oct 8, 1993
Sold by
Mordini Bros Constr
Bought by
Lane William B and Lane Rosemary J
Home Financials for this Owner
Home Financials are based on the most recent Mortgage that was taken out on this home.
Original Mortgage
$203,150
Interest Rate
6.9%
Mortgage Type
Purchase Money Mortgage
Create a Home Valuation Report for This Property
The Home Valuation Report is an in-depth analysis detailing your home's value as well as a comparison with similar homes in the area
Home Values in the Area
Average Home Value in this Area
Purchase History
| Date | Buyer | Sale Price | Title Company |
|---|---|---|---|
| Peck Christopher E | $665,000 | -- | |
| Lane William B | $310,000 | -- |
Source: Public Records
Mortgage History
| Date | Status | Borrower | Loan Amount |
|---|---|---|---|
| Open | Lane William B | $413,000 | |
| Closed | Lane William B | $417,000 | |
| Closed | Peck Christopher E | $417,000 | |
| Previous Owner | Lane William B | $50,000 | |
| Previous Owner | Lane William B | $203,150 |
Source: Public Records
Tax History
| Year | Tax Paid | Tax Assessment Tax Assessment Total Assessment is a certain percentage of the fair market value that is determined by local assessors to be the total taxable value of land and additions on the property. | Land | Improvement |
|---|---|---|---|---|
| 2025 | $13,293 | $1,005,500 | $314,800 | $690,700 |
| 2024 | $12,387 | $916,900 | $288,600 | $628,300 |
| 2023 | $11,863 | $834,800 | $275,000 | $559,800 |
| 2022 | $11,446 | $788,300 | $256,700 | $531,600 |
| 2021 | $11,021 | $747,700 | $250,200 | $497,500 |
| 2020 | $10,677 | $732,800 | $250,200 | $482,600 |
| 2019 | $10,644 | $724,100 | $269,200 | $454,900 |
| 2018 | $10,522 | $722,200 | $279,600 | $442,600 |
| 2017 | $9,577 | $636,800 | $270,900 | $365,900 |
| 2016 | $9,480 | $639,700 | $266,200 | $373,500 |
| 2015 | $8,976 | $590,900 | $212,900 | $378,000 |
| 2014 | $8,747 | $583,500 | $212,900 | $370,600 |
Source: Public Records
Map
Nearby Homes
Your Personal Tour Guide
Ask me questions while you tour the home.