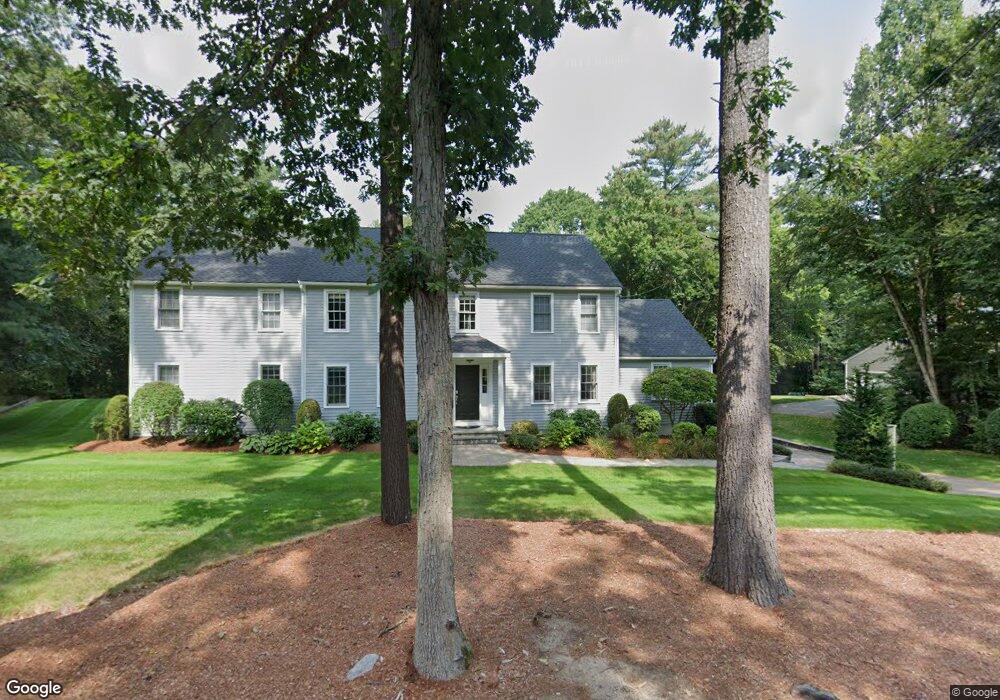
8 Granite St Medway, MA 02053
Estimated Value: $877,000 - $1,010,000
4
Beds
3
Baths
3,251
Sq Ft
$291/Sq Ft
Est. Value
About This Home
This home is located at 8 Granite St, Medway, MA 02053 and is currently estimated at $947,262, approximately $291 per square foot. 8 Granite St is a home located in Norfolk County with nearby schools including John D. McGovern Elementary School, Burke-Memorial Elementary, and Medway Middle School.
Ownership History
Date
Name
Owned For
Owner Type
Purchase Details
Closed on
Dec 26, 2018
Sold by
M & W Canty Rt
Bought by
Granite Street Farm Llc
Current Estimated Value
Purchase Details
Closed on
Apr 21, 1995
Sold by
Ronca Rt
Bought by
Keller William C and Keller Inna
Home Financials for this Owner
Home Financials are based on the most recent Mortgage that was taken out on this home.
Original Mortgage
$191,600
Interest Rate
8.55%
Mortgage Type
Purchase Money Mortgage
Create a Home Valuation Report for This Property
The Home Valuation Report is an in-depth analysis detailing your home's value as well as a comparison with similar homes in the area
Home Values in the Area
Average Home Value in this Area
Purchase History
| Date | Buyer | Sale Price | Title Company |
|---|---|---|---|
| Granite Street Farm Llc | $125,000 | -- | |
| Keller William C | $239,500 | -- |
Source: Public Records
Mortgage History
| Date | Status | Borrower | Loan Amount |
|---|---|---|---|
| Previous Owner | Keller William C | $210,000 | |
| Previous Owner | Keller William C | $192,500 | |
| Previous Owner | Keller William C | $191,600 |
Source: Public Records
Tax History
| Year | Tax Paid | Tax Assessment Tax Assessment Total Assessment is a certain percentage of the fair market value that is determined by local assessors to be the total taxable value of land and additions on the property. | Land | Improvement |
|---|---|---|---|---|
| 2025 | $11,436 | $802,500 | $327,200 | $475,300 |
| 2024 | $11,556 | $802,500 | $327,200 | $475,300 |
| 2023 | $11,410 | $715,800 | $297,800 | $418,000 |
| 2022 | $10,615 | $627,000 | $220,200 | $406,800 |
| 2021 | $10,640 | $609,400 | $205,500 | $403,900 |
| 2020 | $10,591 | $605,200 | $205,500 | $399,700 |
| 2019 | $9,888 | $582,700 | $197,100 | $385,600 |
| 2018 | $9,971 | $564,600 | $188,700 | $375,900 |
| 2017 | $9,870 | $550,800 | $184,600 | $366,200 |
| 2016 | $9,477 | $523,300 | $169,900 | $353,400 |
| 2015 | $8,976 | $492,100 | $167,800 | $324,300 |
| 2014 | $8,653 | $459,300 | $167,800 | $291,500 |
Source: Public Records
Map
Nearby Homes
- 22 Granite St
- 15 Fox Run Rd
- 42 Fisher St
- 56 Fisher St
- 28 Fisher St
- 8 Liberty Rd
- 462 Hartford Ave
- 2 Kingson Ln Unit 2
- 23 Cedar Farms Rd
- 394 Village St
- 6 Freedom Trail
- 21 Carp Rd
- 429 South St
- 8 Apache Rd
- 56 Puddingstone Ln
- 22 Milford St
- 21 Maple St
- 4 Linda Ln
- 20 Hawthorne Village Unit A
- 44 Black Bear Cir Unit 44
Your Personal Tour Guide
Ask me questions while you tour the home.