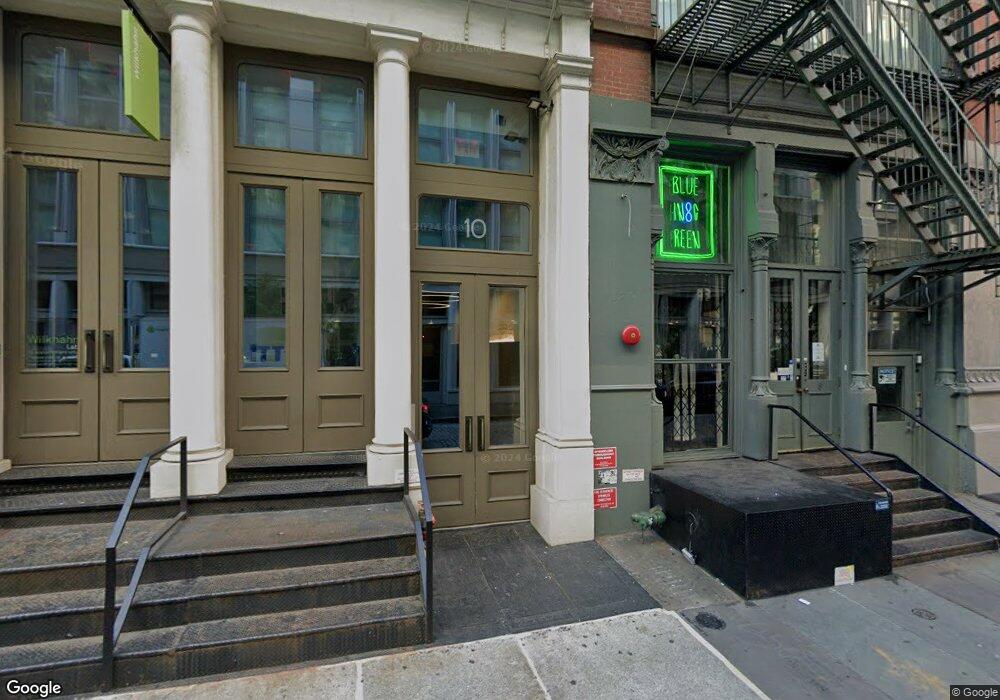
8 Greene St Unit 6 New York, NY 10013
SoHo NeighborhoodEstimated Value: $3,378,000 - $4,134,915
2
Beds
2
Baths
1,700
Sq Ft
$2,225/Sq Ft
Est. Value
About This Home
This home is located at 8 Greene St Unit 6, New York, NY 10013 and is currently estimated at $3,782,479, approximately $2,224 per square foot. 8 Greene St Unit 6 is a home located in New York County with nearby schools including P.S. 3 Charrette School, Middle School 297, and Clinton School.
Ownership History
Date
Name
Owned For
Owner Type
Purchase Details
Closed on
Jul 1, 2015
Sold by
Picquot Alexandre
Bought by
Seitz John
Current Estimated Value
Home Financials for this Owner
Home Financials are based on the most recent Mortgage that was taken out on this home.
Original Mortgage
$2,000,000
Outstanding Balance
$1,565,453
Interest Rate
3.97%
Mortgage Type
Purchase Money Mortgage
Estimated Equity
$2,217,026
Purchase Details
Closed on
Mar 31, 2011
Sold by
Perry Christina Maria
Bought by
Picquot Alexandre
Purchase Details
Closed on
Oct 22, 1998
Sold by
8 Greene Street Building Partners Llc
Bought by
Kunetz Christina
Home Financials for this Owner
Home Financials are based on the most recent Mortgage that was taken out on this home.
Original Mortgage
$311,125
Interest Rate
6.49%
Create a Home Valuation Report for This Property
The Home Valuation Report is an in-depth analysis detailing your home's value as well as a comparison with similar homes in the area
Home Values in the Area
Average Home Value in this Area
Purchase History
| Date | Buyer | Sale Price | Title Company |
|---|---|---|---|
| Seitz John | $2,935,000 | -- | |
| Picquot Alexandre | $1,550,000 | -- | |
| Kunetz Christina | $406,000 | -- |
Source: Public Records
Mortgage History
| Date | Status | Borrower | Loan Amount |
|---|---|---|---|
| Open | Seitz John | $2,000,000 | |
| Previous Owner | Kunetz Christina | $311,125 |
Source: Public Records
Tax History Compared to Growth
Tax History
| Year | Tax Paid | Tax Assessment Tax Assessment Total Assessment is a certain percentage of the fair market value that is determined by local assessors to be the total taxable value of land and additions on the property. | Land | Improvement |
|---|---|---|---|---|
| 2025 | $21,856 | $180,413 | $13,339 | $167,074 |
| 2024 | $21,856 | $174,818 | $37,288 | $164,101 |
| 2023 | $16,382 | $161,870 | $10,683 | $151,187 |
| 2022 | $15,129 | $612,060 | $37,288 | $574,772 |
| 2021 | $17,024 | $720,110 | $37,288 | $682,822 |
| 2020 | $14,281 | $699,157 | $37,288 | $661,869 |
| 2019 | $13,992 | $582,621 | $37,288 | $545,333 |
| 2018 | $15,837 | $124,515 | $9,563 | $114,952 |
| 2017 | $14,664 | $115,293 | $10,016 | $105,277 |
| 2016 | $13,763 | $106,753 | $10,228 | $96,525 |
| 2015 | $8,935 | $106,753 | $10,828 | $95,925 |
| 2014 | $8,935 | $103,443 | $8,742 | $94,701 |
Source: Public Records
Map
Nearby Homes
- 14-16 Wooster St Unit 2
- 22 Wooster St Unit PHN
- 75 Grand St Unit 3-E
- 75 Grand St Unit 4W
- 311 W Broadway Unit 2A
- 311 W Broadway Unit 3G
- 311 W Broadway Unit 5I
- 31 Greene St Unit 1
- 325 W Broadway Unit 4B
- 325 W Broadway Unit 7B
- 27 Wooster St Unit PH
- 27 Wooster St Unit 4A
- 20 Greene St Unit PH
- 10 Greene St Unit PENTHOUSE
- 74 Grand St Unit 5
- 64 Grand St Unit 5
- 35 Mercer St Unit 3W
- 41 Greene St Unit 5
- 40 Mercer St Unit 7
- 391 Canal St
- 8 Greene St
- 8 Greene St Unit ID1035005P
- 8 Greene St Unit 5
- 8 Greene St Unit 4
- 8 Greene St Unit 3
- 8 Greene St Unit 2
- 8 Greene St Unit 1
- 8 Greene St
- 8 Greene St Unit 1/2
- 8 Greene St Unit PH
- 12-14 Greene St
- 10 Greene St Unit 8
- 10 Greene St
- 10 Greene St Unit 4
- 10 Greene St Unit PH
- 10 Greene St Unit 2
- 10 Greene St Unit 3
- 329-331 Canal St
- 12 Greene St Unit 14
- 12 Greene St Unit 3