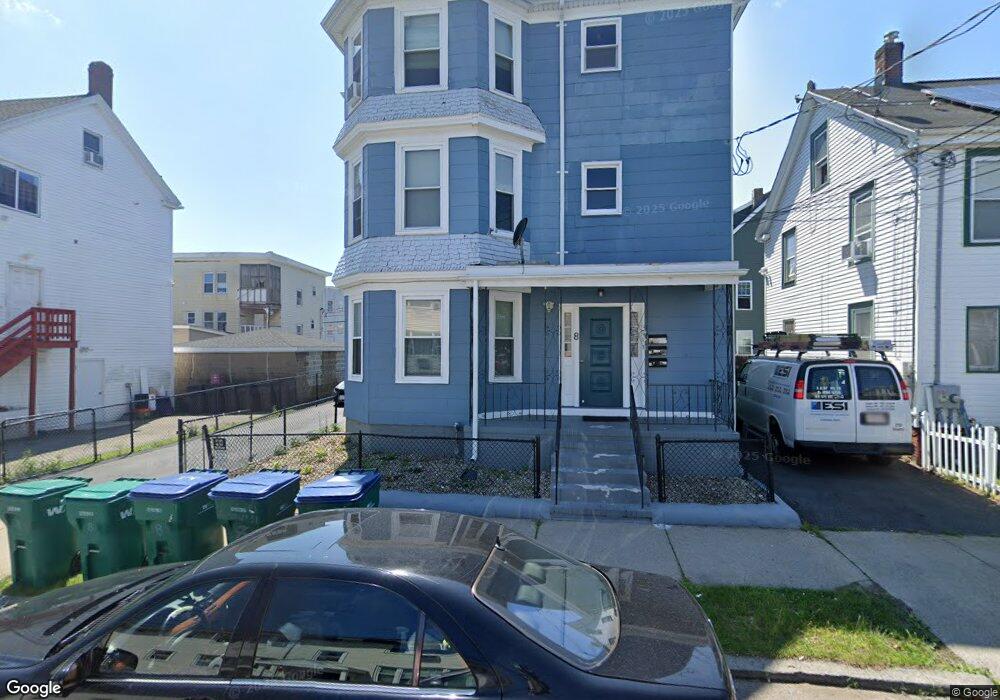
8 Grove St Unit 3 Lynn, MA 01905
Pine Hill NeighborhoodEstimated Value: $791,000 - $1,007,000
2
Beds
1
Bath
1,000
Sq Ft
$919/Sq Ft
Est. Value
About This Home
This home is located at 8 Grove St Unit 3, Lynn, MA 01905 and is currently estimated at $919,279, approximately $919 per square foot. 8 Grove St Unit 3 is a home located in Essex County with nearby schools including North Park Elementary School, William R. Fallon School, and Tracy Elementary School.
Ownership History
Date
Name
Owned For
Owner Type
Purchase Details
Closed on
Feb 22, 2012
Sold by
Us Bank Na
Bought by
Ciampa Investments Inc
Current Estimated Value
Purchase Details
Closed on
Oct 31, 2011
Sold by
Us Bank Na
Bought by
Ciampa Investments Llc
Purchase Details
Closed on
Apr 29, 2011
Sold by
Us Bk Na and Cherry
Bought by
Us Bk Na
Purchase Details
Closed on
Jun 9, 2006
Sold by
Odomore-Irinms Itohan P
Bought by
Chery Violette R
Home Financials for this Owner
Home Financials are based on the most recent Mortgage that was taken out on this home.
Original Mortgage
$360,000
Interest Rate
6.62%
Mortgage Type
Purchase Money Mortgage
Purchase Details
Closed on
Apr 29, 2004
Sold by
Burke Michael J and Burke Ruth Helen
Bought by
Odomore-Irinms Itohan P
Create a Home Valuation Report for This Property
The Home Valuation Report is an in-depth analysis detailing your home's value as well as a comparison with similar homes in the area
Home Values in the Area
Average Home Value in this Area
Purchase History
| Date | Buyer | Sale Price | Title Company |
|---|---|---|---|
| Ciampa Investments Inc | -- | -- | |
| Ciampa Investments Llc | $205,000 | -- | |
| Us Bk Na | $195,500 | -- | |
| Chery Violette R | $450,000 | -- | |
| Odomore-Irinms Itohan P | $361,000 | -- |
Source: Public Records
Mortgage History
| Date | Status | Borrower | Loan Amount |
|---|---|---|---|
| Open | Odomore-Irinms Itohan P | $260,000 | |
| Previous Owner | Odomore-Irinms Itohan P | $360,000 |
Source: Public Records
Tax History Compared to Growth
Tax History
| Year | Tax Paid | Tax Assessment Tax Assessment Total Assessment is a certain percentage of the fair market value that is determined by local assessors to be the total taxable value of land and additions on the property. | Land | Improvement |
|---|---|---|---|---|
| 2025 | $7,900 | $762,500 | $183,200 | $579,300 |
| 2024 | $7,846 | $745,100 | $172,200 | $572,900 |
| 2023 | $7,556 | $677,700 | $166,800 | $510,900 |
| 2022 | $7,592 | $610,800 | $154,500 | $456,300 |
| 2021 | $7,341 | $563,400 | $148,400 | $415,000 |
| 2020 | $6,600 | $492,500 | $130,800 | $361,700 |
| 2019 | $6,205 | $433,900 | $107,000 | $326,900 |
| 2018 | $5,537 | $365,500 | $88,900 | $276,600 |
| 2017 | $5,103 | $327,100 | $75,400 | $251,700 |
| 2016 | $4,718 | $291,600 | $67,200 | $224,400 |
| 2015 | $4,253 | $253,900 | $62,700 | $191,200 |
Source: Public Records
Map
Nearby Homes
- 40 Grove St
- 10 Carnes St
- 75 Moulton St
- 39 Centre St
- 662-664 Western Ave
- 693 Western Ave Unit 101
- 447 Boston St
- 274 Boston St
- 66 Harwood St
- 25 Bulfinch St
- 11 Linwood Rd
- 93 Robinson St
- 121 N Common St
- 505-507 Boston St
- 108 Franklin St
- 43 Baker St
- 20 Huss Ct Unit 105
- 14 Atkinson St
- 99 Franklin St
- 20 Murray St