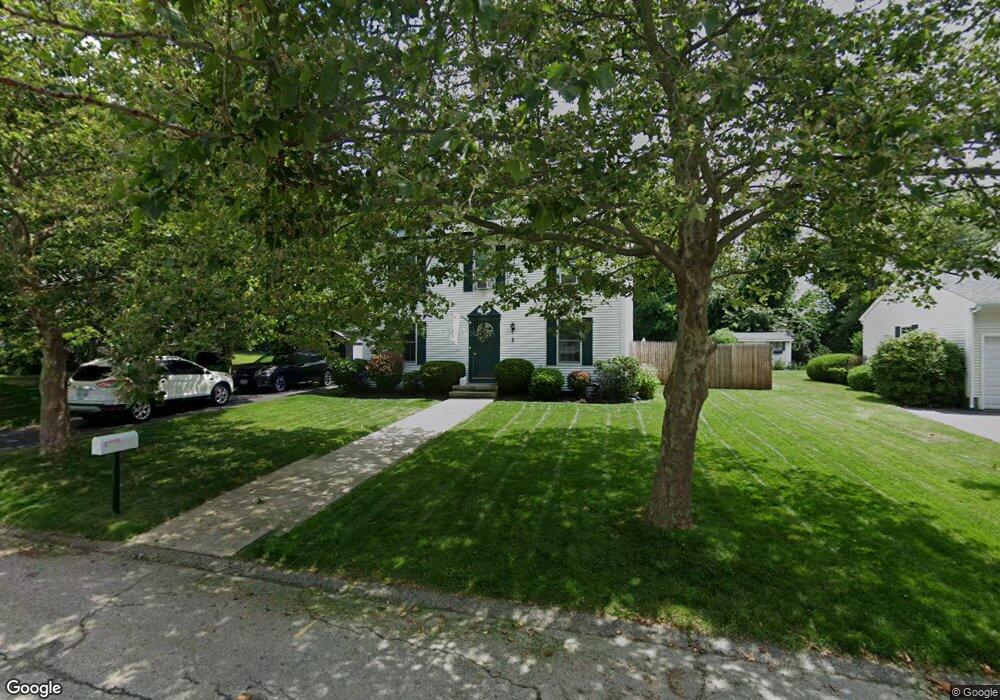
8 Hamlet Ct Bristol, RI 02809
Bristol Highlands NeighborhoodEstimated Value: $607,455 - $762,000
3
Beds
3
Baths
2,240
Sq Ft
$305/Sq Ft
Est. Value
About This Home
This home is located at 8 Hamlet Ct, Bristol, RI 02809 and is currently estimated at $683,614, approximately $305 per square foot. 8 Hamlet Ct is a home located in Bristol County with nearby schools including Mt. Hope High School, Highlander Charter Middle and High School, and Our Lady of Mt. Carmel School.
Ownership History
Date
Name
Owned For
Owner Type
Purchase Details
Closed on
Jun 24, 2005
Sold by
Fncl Cendant Mobility
Bought by
Sullivan Thomas P and Sullivan Christine M
Current Estimated Value
Home Financials for this Owner
Home Financials are based on the most recent Mortgage that was taken out on this home.
Original Mortgage
$74,800
Interest Rate
5.82%
Purchase Details
Closed on
Sep 22, 2003
Sold by
King Deborah and King William
Bought by
Lawson Robert and Lawson Margaret
Purchase Details
Closed on
Jan 30, 1998
Sold by
Winquist Carl A
Bought by
Masse Rene O and Masse Joan
Create a Home Valuation Report for This Property
The Home Valuation Report is an in-depth analysis detailing your home's value as well as a comparison with similar homes in the area
Home Values in the Area
Average Home Value in this Area
Purchase History
| Date | Buyer | Sale Price | Title Company |
|---|---|---|---|
| Sullivan Thomas P | $374,000 | -- | |
| Cendant Mobilit Fncl C | $374,000 | -- | |
| Lawson Robert | $320,000 | -- | |
| Masse Rene O | $125,000 | -- |
Source: Public Records
Mortgage History
| Date | Status | Borrower | Loan Amount |
|---|---|---|---|
| Open | Masse Rene O | $282,900 | |
| Closed | Masse Rene O | $74,800 | |
| Closed | Masse Rene O | $299,200 |
Source: Public Records
Tax History
| Year | Tax Paid | Tax Assessment Tax Assessment Total Assessment is a certain percentage of the fair market value that is determined by local assessors to be the total taxable value of land and additions on the property. | Land | Improvement |
|---|---|---|---|---|
| 2025 | $5,582 | $403,900 | $153,300 | $250,600 |
| 2024 | $5,582 | $403,900 | $153,300 | $250,600 |
| 2023 | $5,396 | $403,900 | $153,300 | $250,600 |
| 2022 | $5,251 | $403,900 | $153,300 | $250,600 |
| 2021 | $4,613 | $320,800 | $128,400 | $192,400 |
| 2020 | $4,514 | $320,800 | $128,400 | $192,400 |
| 2019 | $4,401 | $320,800 | $128,400 | $192,400 |
| 2018 | $4,734 | $307,800 | $126,300 | $181,500 |
| 2017 | $4,303 | $288,400 | $118,800 | $169,600 |
| 2016 | $4,260 | $288,400 | $118,800 | $169,600 |
| 2015 | $3,976 | $283,400 | $118,800 | $164,600 |
| 2014 | $3,651 | $279,520 | $120,200 | $159,320 |
Source: Public Records
Map
Nearby Homes
- 3 Knowlton Ct
- 7 Knowlton Ct
- 5 Knowlton Ct
- 1 Knowlton Ct
- 1220 Hope St
- 1270 Hope St
- 669 Metacom Ave Unit 25
- 677 Metacom Ave Unit 64
- 1 Hydraulion Ave
- 556 Metacom Ave
- 29 Forest Rd
- 506 Clarks Row
- 1382 Hope St
- 30 Sowams Dr
- 461 North Ln
- 0 Surf Dr
- 417 North Ln
- 15 Rosedale Dr
- 35 Seabreeze Ln
- 5 Saint Theresa Ave
Your Personal Tour Guide
Ask me questions while you tour the home.