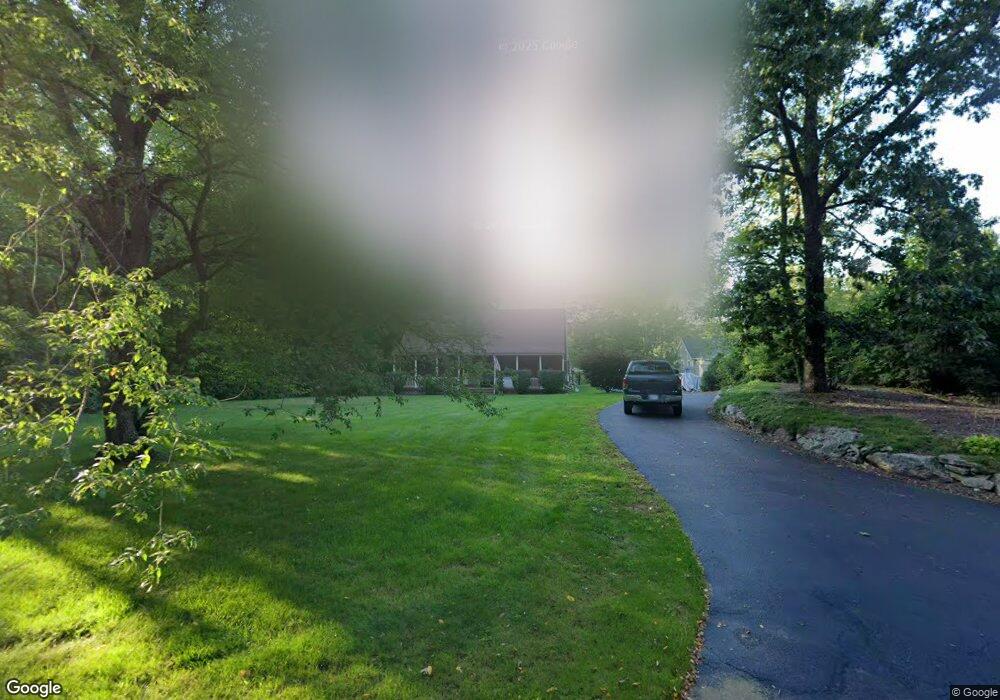
8 Hammond St Rochdale, MA 01542
Estimated Value: $557,000 - $649,000
3
Beds
2
Baths
2,208
Sq Ft
$271/Sq Ft
Est. Value
About This Home
This home is located at 8 Hammond St, Rochdale, MA 01542 and is currently estimated at $598,933, approximately $271 per square foot. 8 Hammond St is a home located in Worcester County with nearby schools including Leicester Integrated Preschool, Leicester Memorial Elementary School, and Leicester Middle School.
Ownership History
Date
Name
Owned For
Owner Type
Purchase Details
Closed on
Jun 8, 2011
Sold by
Hartz Elizabeth
Bought by
Hartz David
Current Estimated Value
Purchase Details
Closed on
Dec 15, 2006
Sold by
Hartz David W
Bought by
Hartz Elizabeth M
Purchase Details
Closed on
Aug 16, 1996
Sold by
Bouvier Michael S and Bouvier Tina
Bought by
Hartz David W and Hartz Elizabeth
Home Financials for this Owner
Home Financials are based on the most recent Mortgage that was taken out on this home.
Original Mortgage
$155,138
Interest Rate
8.08%
Mortgage Type
Purchase Money Mortgage
Create a Home Valuation Report for This Property
The Home Valuation Report is an in-depth analysis detailing your home's value as well as a comparison with similar homes in the area
Home Values in the Area
Average Home Value in this Area
Purchase History
| Date | Buyer | Sale Price | Title Company |
|---|---|---|---|
| Hartz David | -- | -- | |
| Hartz Elizabeth M | -- | -- | |
| Hartz David W | $168,900 | -- |
Source: Public Records
Mortgage History
| Date | Status | Borrower | Loan Amount |
|---|---|---|---|
| Previous Owner | Hartz David W | $249,000 | |
| Previous Owner | Hartz David W | $152,900 | |
| Previous Owner | Hartz David W | $155,138 |
Source: Public Records
Tax History Compared to Growth
Tax History
| Year | Tax Paid | Tax Assessment Tax Assessment Total Assessment is a certain percentage of the fair market value that is determined by local assessors to be the total taxable value of land and additions on the property. | Land | Improvement |
|---|---|---|---|---|
| 2025 | $6,485 | $551,000 | $132,400 | $418,600 |
| 2024 | $6,170 | $491,600 | $120,000 | $371,600 |
| 2023 | $5,889 | $457,900 | $120,000 | $337,900 |
| 2022 | $5,712 | $408,300 | $114,500 | $293,800 |
| 2021 | $6,031 | $398,600 | $104,700 | $293,900 |
| 2020 | $5,564 | $373,200 | $105,200 | $268,000 |
| 2019 | $5,323 | $353,000 | $96,500 | $256,500 |
| 2018 | $5,693 | $353,800 | $120,600 | $233,200 |
| 2017 | $4,904 | $316,800 | $83,600 | $233,200 |
| 2016 | $4,474 | $300,300 | $90,300 | $210,000 |
| 2015 | $4,366 | $300,300 | $90,300 | $210,000 |
Source: Public Records
Map
Nearby Homes