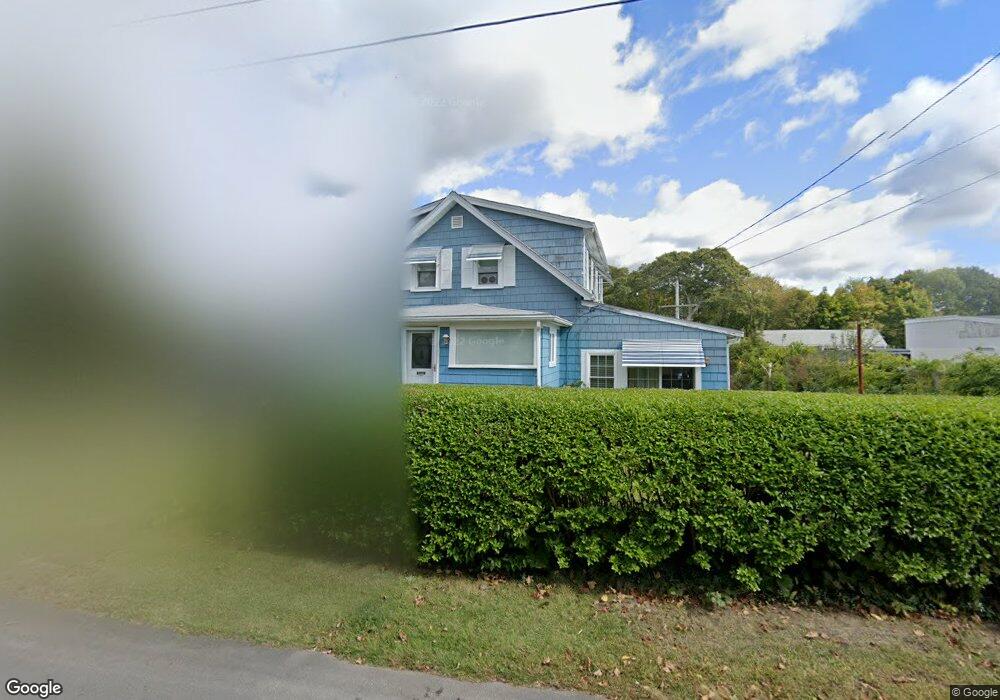
8 Harrison Ave Bourne, MA 2532
Buzzards Bay NeighborhoodEstimated Value: $495,000 - $582,862
4
Beds
2
Baths
1,569
Sq Ft
$337/Sq Ft
Est. Value
About This Home
This home is located at 8 Harrison Ave, Bourne, MA 2532 and is currently estimated at $528,466, approximately $336 per square foot. 8 Harrison Ave is a home located in Barnstable County with nearby schools including Bourne High School and St Margaret Regional School.
Ownership History
Date
Name
Owned For
Owner Type
Purchase Details
Closed on
Jun 3, 2025
Sold by
Casey James and Casey Patricia
Bought by
Allen Matthew and Allen Montanna M
Current Estimated Value
Home Financials for this Owner
Home Financials are based on the most recent Mortgage that was taken out on this home.
Original Mortgage
$490,943
Outstanding Balance
$488,830
Interest Rate
6.81%
Mortgage Type
FHA
Estimated Equity
$39,636
Purchase Details
Closed on
Nov 5, 2024
Sold by
Rood Richard F
Bought by
Casey James and Casey Patricia
Home Financials for this Owner
Home Financials are based on the most recent Mortgage that was taken out on this home.
Original Mortgage
$350,000
Interest Rate
6.09%
Mortgage Type
Purchase Money Mortgage
Purchase Details
Closed on
Oct 3, 1969
Bought by
Rood Richard F and Rood Charlene N
Create a Home Valuation Report for This Property
The Home Valuation Report is an in-depth analysis detailing your home's value as well as a comparison with similar homes in the area
Home Values in the Area
Average Home Value in this Area
Purchase History
| Date | Buyer | Sale Price | Title Company |
|---|---|---|---|
| Allen Matthew | $500,000 | None Available | |
| Allen Matthew | $500,000 | None Available | |
| Casey James | $437,500 | None Available | |
| Casey James | $437,500 | None Available | |
| Casey James | $437,500 | None Available | |
| Rood Richard F | -- | -- |
Source: Public Records
Mortgage History
| Date | Status | Borrower | Loan Amount |
|---|---|---|---|
| Open | Allen Matthew | $490,943 | |
| Closed | Allen Matthew | $490,943 | |
| Previous Owner | Casey James | $350,000 |
Source: Public Records
Tax History
| Year | Tax Paid | Tax Assessment Tax Assessment Total Assessment is a certain percentage of the fair market value that is determined by local assessors to be the total taxable value of land and additions on the property. | Land | Improvement |
|---|---|---|---|---|
| 2025 | $3,472 | $444,500 | $198,000 | $246,500 |
| 2024 | $3,771 | $470,200 | $188,500 | $281,700 |
| 2023 | $3,379 | $383,500 | $133,500 | $250,000 |
| 2022 | $3,067 | $304,000 | $118,100 | $185,900 |
| 2021 | $2,989 | $277,500 | $107,500 | $170,000 |
| 2020 | $2,893 | $269,400 | $106,500 | $162,900 |
| 2019 | $2,740 | $260,700 | $106,500 | $154,200 |
| 2018 | $2,620 | $248,600 | $101,400 | $147,200 |
| 2017 | $2,536 | $246,200 | $100,500 | $145,700 |
| 2016 | $2,315 | $227,900 | $100,500 | $127,400 |
| 2015 | $2,295 | $227,900 | $100,500 | $127,400 |
Source: Public Records
Map
Nearby Homes
- 46 Holt Rd Unit B
- 46 Holt Rd
- 23 Alderberry Rd
- 40-A Lafayette Ave
- 4 Van Bummel Rd
- 58 Maple St
- 38 Old Bridge Rd
- 304 Main St
- 60 Bourne Neck Dr
- 6 Honora Ct
- 3 Honora Ln Unit 3
- 60 Sandwich Rd
- 44 Cotuit Rd
- 5 Zoli Ln
- 10 Sandy Ln
- 9 Hideaway Rd Unit F
- 13 Hideaway Village Unit G
- 13 Laurel Hill Ct
- 92 Choctaw Dr
- 810 Head of The Bay Rd
Your Personal Tour Guide
Ask me questions while you tour the home.