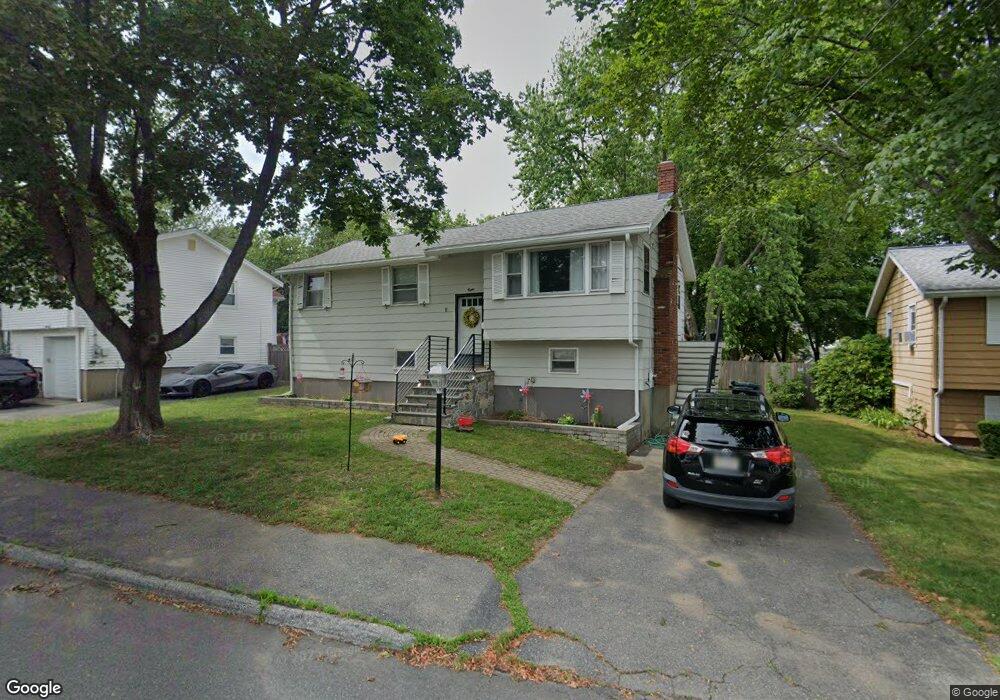
8 Hartford St Salem, MA 01970
Witchcraft Heights NeighborhoodEstimated Value: $565,000 - $601,000
3
Beds
1
Bath
986
Sq Ft
$586/Sq Ft
Est. Value
About This Home
This home is located at 8 Hartford St, Salem, MA 01970 and is currently estimated at $577,795, approximately $585 per square foot. 8 Hartford St is a home located in Essex County with nearby schools including Witchcraft Heights Elementary School, Horace Mann Laboratory, and Bates Elementary School.
Ownership History
Date
Name
Owned For
Owner Type
Purchase Details
Closed on
Dec 31, 2020
Sold by
8 Hartford St Salem Rt
Bought by
Kirkorian Christopher P and Maney Kathleen K
Current Estimated Value
Home Financials for this Owner
Home Financials are based on the most recent Mortgage that was taken out on this home.
Original Mortgage
$366,300
Outstanding Balance
$326,867
Interest Rate
2.7%
Mortgage Type
FHA
Estimated Equity
$250,929
Purchase Details
Closed on
Mar 11, 2020
Sold by
Otoole Paul F
Bought by
8 Hartford St Salem Rt
Create a Home Valuation Report for This Property
The Home Valuation Report is an in-depth analysis detailing your home's value as well as a comparison with similar homes in the area
Home Values in the Area
Average Home Value in this Area
Purchase History
| Date | Buyer | Sale Price | Title Company |
|---|---|---|---|
| Kirkorian Christopher P | $390,000 | None Available | |
| 8 Hartford St Salem Rt | -- | None Available |
Source: Public Records
Mortgage History
| Date | Status | Borrower | Loan Amount |
|---|---|---|---|
| Open | Kirkorian Christopher P | $366,300 |
Source: Public Records
Tax History Compared to Growth
Tax History
| Year | Tax Paid | Tax Assessment Tax Assessment Total Assessment is a certain percentage of the fair market value that is determined by local assessors to be the total taxable value of land and additions on the property. | Land | Improvement |
|---|---|---|---|---|
| 2025 | $5,469 | $482,300 | $221,900 | $260,400 |
| 2024 | $5,452 | $469,200 | $209,400 | $259,800 |
| 2023 | $5,214 | $416,800 | $190,600 | $226,200 |
| 2022 | $5,018 | $378,700 | $175,000 | $203,700 |
| 2021 | $4,776 | $346,100 | $162,500 | $183,600 |
| 2020 | $4,943 | $342,100 | $159,400 | $182,700 |
| 2019 | $4,888 | $323,700 | $150,000 | $173,700 |
| 2018 | $4,725 | $307,200 | $140,000 | $167,200 |
| 2017 | $4,528 | $285,500 | $131,200 | $154,300 |
| 2016 | $4,474 | $285,500 | $131,200 | $154,300 |
| 2015 | $4,217 | $257,000 | $115,600 | $141,400 |
Source: Public Records
Map
Nearby Homes
- 176 Marlborough Rd
- 159 Marlborough Rd
- 25 Outlook Ave
- 46 Sutton St
- 13 State St
- 9 Sutton St
- 11 Osborne Hill Dr
- 36 Valley St
- 38 Valley St
- 2 Osborne St
- 57 Ord St
- 36 Summit St
- 15 Wall St
- 21 Chanelle Cir
- 55 Butler St
- 111 Foster St Unit 401
- 111 Foster St Unit 416
- 119 Highland Ave
- 10 Elliott Place Unit 1R
- 145 Boston St