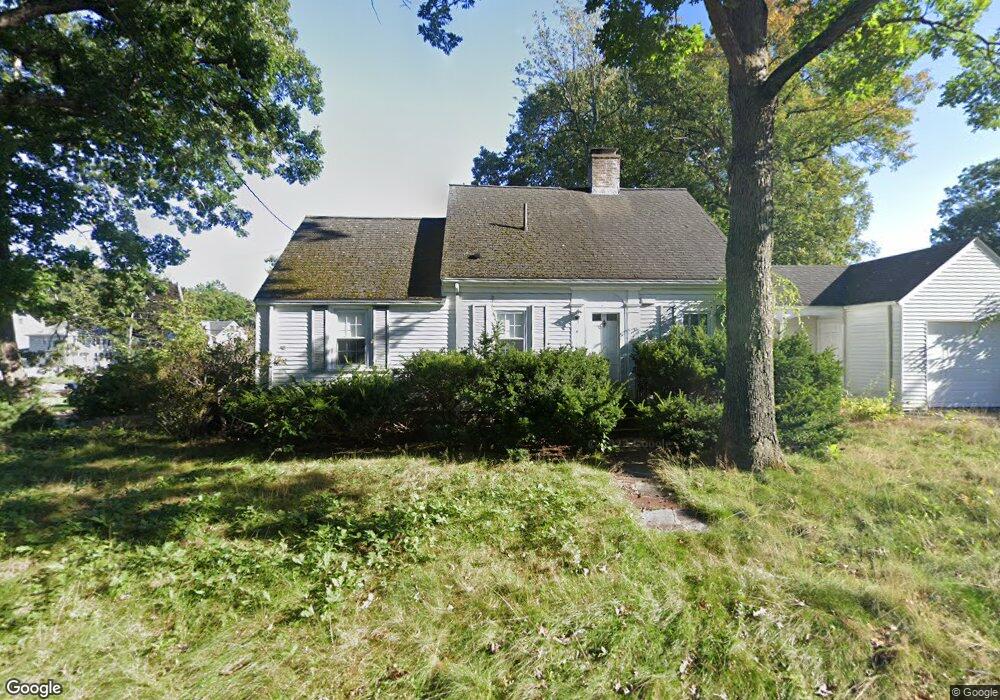
8 Hemlock St Needham, MA 02492
Estimated Value: $1,174,000 - $1,455,000
3
Beds
1
Bath
1,638
Sq Ft
$799/Sq Ft
Est. Value
About This Home
This home is located at 8 Hemlock St, Needham, MA 02492 and is currently estimated at $1,308,390, approximately $798 per square foot. 8 Hemlock St is a home located in Norfolk County with nearby schools including Mitchell Elementary School, High Rock Middle School, and Pollard Middle School.
Ownership History
Date
Name
Owned For
Owner Type
Purchase Details
Closed on
Nov 24, 2010
Sold by
Bernadette P Hungler R and Hungler Charles E
Bought by
Acomb Lindsay
Current Estimated Value
Home Financials for this Owner
Home Financials are based on the most recent Mortgage that was taken out on this home.
Original Mortgage
$190,000
Outstanding Balance
$125,231
Interest Rate
4.25%
Mortgage Type
Purchase Money Mortgage
Estimated Equity
$1,183,159
Purchase Details
Closed on
Dec 18, 2009
Sold by
Hungler Bernadette P
Bought by
Bernadette P Hungler R and Hungler Bernadette P
Create a Home Valuation Report for This Property
The Home Valuation Report is an in-depth analysis detailing your home's value as well as a comparison with similar homes in the area
Home Values in the Area
Average Home Value in this Area
Purchase History
| Date | Buyer | Sale Price | Title Company |
|---|---|---|---|
| Acomb Lindsay | $514,000 | -- | |
| Bernadette P Hungler R | -- | -- |
Source: Public Records
Mortgage History
| Date | Status | Borrower | Loan Amount |
|---|---|---|---|
| Open | Acomb Lindsay | $190,000 |
Source: Public Records
Tax History
| Year | Tax Paid | Tax Assessment Tax Assessment Total Assessment is a certain percentage of the fair market value that is determined by local assessors to be the total taxable value of land and additions on the property. | Land | Improvement |
|---|---|---|---|---|
| 2025 | $10,178 | $960,200 | $789,000 | $171,200 |
| 2024 | $9,508 | $759,400 | $580,800 | $178,600 |
| 2023 | $9,724 | $745,700 | $580,800 | $164,900 |
| 2022 | $8,986 | $672,100 | $514,000 | $158,100 |
| 2021 | $8,757 | $672,100 | $514,000 | $158,100 |
| 2020 | $8,296 | $664,200 | $514,200 | $150,000 |
| 2019 | $7,581 | $611,900 | $467,400 | $144,500 |
| 2018 | $7,269 | $611,900 | $467,400 | $144,500 |
| 2017 | $7,061 | $593,900 | $467,400 | $126,500 |
| 2016 | $6,874 | $595,700 | $467,400 | $128,300 |
| 2015 | $6,725 | $595,700 | $467,400 | $128,300 |
| 2014 | $5,977 | $513,500 | $389,500 | $124,000 |
Source: Public Records
Map
Nearby Homes
- 40 Otis St Unit L
- 638 Webster St
- 638 Webster St Unit 638
- 26 Pinewood Rd
- 78 Birds Hill Ave
- 19 Highland Ct Unit 19
- 168 Richdale Rd
- 26 Gordon Rd
- 193 Garden St
- 233 Warren St
- 40 High St
- 68 Pleasant St Unit 68
- 1011 Webster St
- 447 Hillside Ave
- 100 Rosemary Way Unit 129
- 701 Greendale Ave
- 73 Maple St Unit 1
- 3 Crescent Rd
- 90 Norfolk St
- 143 Hunting Rd
Your Personal Tour Guide
Ask me questions while you tour the home.