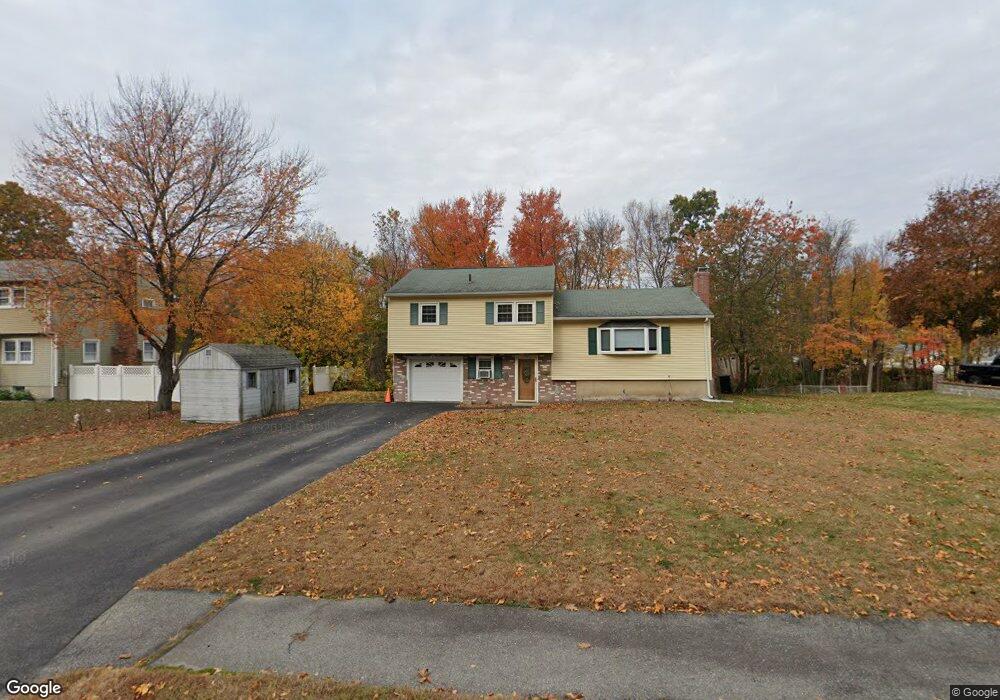
8 Hickory Ln Hudson, MA 01749
Estimated Value: $603,000 - $662,000
About This Home
This home is located at 8 Hickory Ln, Hudson, MA 01749 and is currently estimated at $633,796, approximately $550 per square foot. 8 Hickory Ln is a home located in Middlesex County with nearby schools including David J. Quinn Middle School, Hudson High School, and First Steps Children's Center.
Ownership History
We collect this data history from publicly available records. To have your information removed, we recommend requesting removal directly through your county’s website.
Purchase Details
Purchase Details
Home Values in the Area
Average Home Value in this Area
Purchase History
We collect this data history from publicly available records. To have your information removed, we recommend requesting removal directly through your county’s website.
| Date | Buyer | Sale Price | Title Company |
|---|---|---|---|
| -- | -- | ||
| -- | -- | ||
| $173,000 | -- |
Mortgage History
We collect this data history from publicly available records. To have your information removed, we recommend requesting removal directly through your county’s website.
| Date | Status | Borrower | Loan Amount |
|---|---|---|---|
| Previous Owner | $114,000 | ||
| Previous Owner | $30,000 | ||
| Previous Owner | $105,000 | ||
| Previous Owner | $21,000 |
Tax History
We collect this data history from publicly available records. To have your information removed, we recommend requesting removal directly through your county’s website.
| Year | Tax Paid | Tax Assessment Tax Assessment Total Assessment is a certain percentage of the fair market value that is determined by local assessors to be the total taxable value of land and additions on the property. | Land | Improvement |
|---|---|---|---|---|
| 2025 | $7,966 | $573,900 | $188,300 | $385,600 |
| 2024 | $7,472 | $533,700 | $171,100 | $362,600 |
| 2023 | $6,655 | $455,800 | $164,500 | $291,300 |
| 2022 | $5,989 | $377,600 | $149,500 | $228,100 |
| 2021 | $5,936 | $357,800 | $142,300 | $215,500 |
| 2020 | $5,446 | $327,900 | $139,600 | $188,300 |
| 2019 | $5,373 | $315,500 | $139,600 | $175,900 |
| 2018 | $5,186 | $298,100 | $141,300 | $156,800 |
| 2017 | $5,024 | $287,100 | $139,800 | $147,300 |
| 2016 | $4,905 | $283,700 | $139,800 | $143,900 |
| 2015 | $4,212 | $243,900 | $139,800 | $104,100 |
| 2014 | $4,134 | $237,300 | $122,800 | $114,500 |
Map
- 111 Brigham St Unit 11B
- 111 Brigham St Unit 19A
- 111 Brigham St Unit 20C
- 113 Brigham St Unit 4D
- 12 Forbes Rd
- 8 Reardon Rd
- 51 Deer Path
- 8 Deer Path Unit 8
- 1 Avebury Ln Unit 31
- 0 Washington St
- 48 Fitchburg St
- 102 Park St
- 140 Matheson Dr
- 121 Matheson Dr
- 14 Indian Farm Rd
- 107 Washington St
- 214 River Rd E
- 0 Pleasant St
- 56 Park St
- 290 W Hill Rd
Ask me questions while you tour the home.