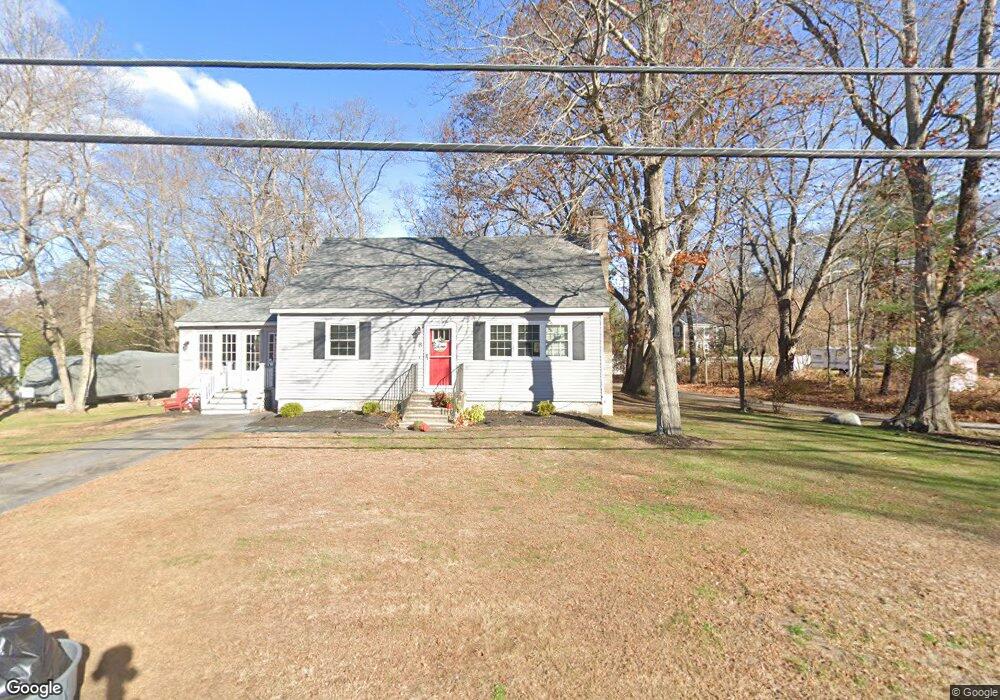
8 High St Salisbury, MA 01952
Estimated Value: $559,000 - $686,000
3
Beds
2
Baths
1,470
Sq Ft
$417/Sq Ft
Est. Value
About This Home
This home is located at 8 High St, Salisbury, MA 01952 and is currently estimated at $612,384, approximately $416 per square foot. 8 High St is a home located in Essex County with nearby schools including Triton Regional High School.
Ownership History
Date
Name
Owned For
Owner Type
Purchase Details
Closed on
Dec 19, 2012
Sold by
Muir Meagan L and Pelletier Justin R
Bought by
Pelletier Justin R and Pelletier Meagan L
Current Estimated Value
Home Financials for this Owner
Home Financials are based on the most recent Mortgage that was taken out on this home.
Original Mortgage
$243,869
Outstanding Balance
$175,492
Interest Rate
3.75%
Mortgage Type
FHA
Estimated Equity
$436,892
Purchase Details
Closed on
Mar 9, 2011
Sold by
Pelletier Justin Roy
Bought by
Muir Meagan L and Pelletier Justin Roy
Purchase Details
Closed on
Dec 13, 2010
Sold by
Brislin Kara M
Bought by
Pelletier Justin Roy
Purchase Details
Closed on
Jul 1, 2009
Sold by
Doyle Paul F and Doyle Beverly L
Bought by
Pelletier Justin
Purchase Details
Closed on
May 30, 1995
Sold by
Doyle Shirley Est and Doyle David
Bought by
Doyle Paul F and Doyle Beverly L
Create a Home Valuation Report for This Property
The Home Valuation Report is an in-depth analysis detailing your home's value as well as a comparison with similar homes in the area
Home Values in the Area
Average Home Value in this Area
Purchase History
| Date | Buyer | Sale Price | Title Company |
|---|---|---|---|
| Pelletier Justin R | -- | -- | |
| Muir Meagan L | -- | -- | |
| Pelletier Justin Roy | -- | -- | |
| Pelletier Justin | $245,000 | -- | |
| Doyle Paul F | $30,720 | -- |
Source: Public Records
Mortgage History
| Date | Status | Borrower | Loan Amount |
|---|---|---|---|
| Open | Doyle Paul F | $243,869 | |
| Previous Owner | Doyle Paul F | $244,117 |
Source: Public Records
Tax History
| Year | Tax Paid | Tax Assessment Tax Assessment Total Assessment is a certain percentage of the fair market value that is determined by local assessors to be the total taxable value of land and additions on the property. | Land | Improvement |
|---|---|---|---|---|
| 2025 | $4,121 | $408,800 | $160,900 | $247,900 |
| 2024 | $4,043 | $386,900 | $160,900 | $226,000 |
| 2023 | $3,932 | $364,100 | $160,900 | $203,200 |
| 2022 | $3,707 | $332,800 | $144,800 | $188,000 |
| 2021 | $3,640 | $323,300 | $144,800 | $178,500 |
| 2020 | $3,454 | $301,400 | $144,800 | $156,600 |
| 2019 | $3,423 | $288,600 | $140,800 | $147,800 |
| 2018 | $3,249 | $275,800 | $129,200 | $146,600 |
| 2017 | $3,003 | $251,900 | $120,700 | $131,200 |
| 2016 | $2,921 | $250,300 | $116,700 | $133,600 |
| 2015 | $2,806 | $238,800 | $108,600 | $130,200 |
Source: Public Records
Map
Nearby Homes
Your Personal Tour Guide
Ask me questions while you tour the home.