8 Hillcrest Rd Milton, MA 02186
Milton Hill NeighborhoodEstimated Value: $870,000 - $1,027,000
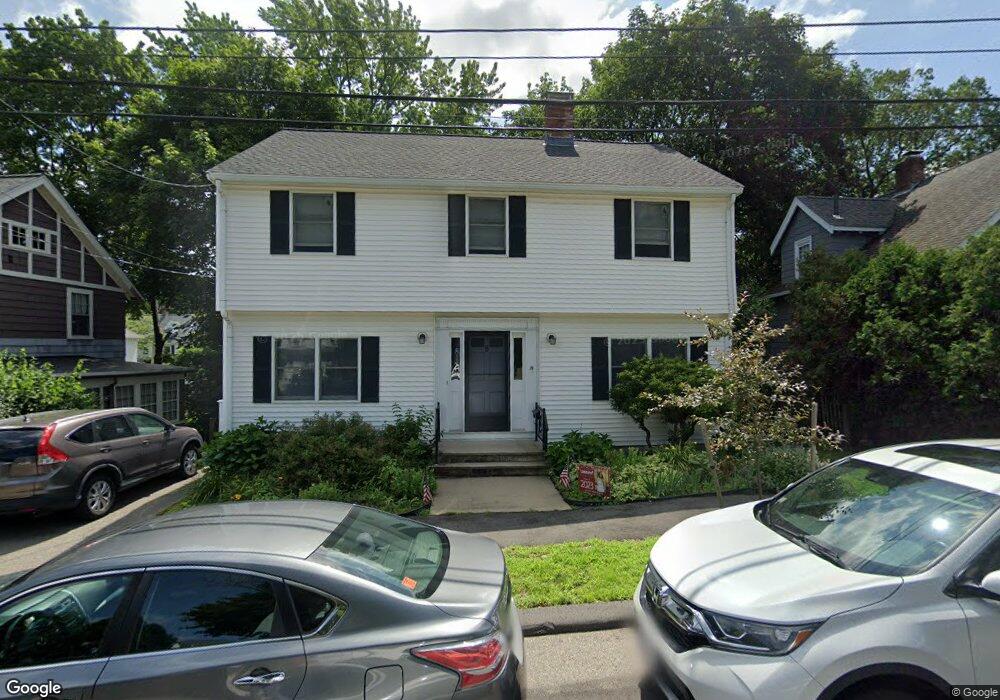
About This Home
This home is located at 8 Hillcrest Rd, Milton, MA 02186 and is currently estimated at $934,216, approximately $549 per square foot. 8 Hillcrest Rd is a home located in Norfolk County with nearby schools including Milton High School, St. Agatha School, and Milton Academy.
Ownership History
We collect this data history from publicly available records. To have your information removed, we recommend requesting removal directly through your county’s website.
Purchase Details
Home Values in the Area
Average Home Value in this Area
Purchase History
We collect this data history from publicly available records. To have your information removed, we recommend requesting removal directly through your county’s website.
| Date | Buyer | Sale Price | Title Company |
|---|---|---|---|
| -- | None Available | ||
| -- | None Available |
Tax History
We collect this data history from publicly available records. To have your information removed, we recommend requesting removal directly through your county’s website.
| Year | Tax Paid | Tax Assessment Tax Assessment Total Assessment is a certain percentage of the fair market value that is determined by local assessors to be the total taxable value of land and additions on the property. | Land | Improvement |
|---|---|---|---|---|
| 2025 | $8,657 | $780,600 | $409,100 | $371,500 |
| 2024 | $8,394 | $768,700 | $389,600 | $379,100 |
| 2023 | $7,950 | $697,400 | $346,400 | $351,000 |
| 2022 | $7,724 | $619,400 | $346,400 | $273,000 |
| 2021 | $7,829 | $596,300 | $336,300 | $260,000 |
| 2020 | $7,674 | $584,900 | $330,000 | $254,900 |
| 2019 | $7,484 | $567,800 | $320,300 | $247,500 |
| 2018 | $7,062 | $511,400 | $267,800 | $243,600 |
| 2017 | $6,606 | $487,200 | $255,100 | $232,100 |
| 2016 | $6,354 | $470,700 | $243,500 | $227,200 |
| 2015 | $6,249 | $448,300 | $226,100 | $222,200 |
Map
- 25 Waldeck Rd
- 94 Grafton Ave
- 440 Granite Ave Unit 201
- 186 Granite Ave
- 7 Phyllis Ln
- 76 Shawmut St
- 141 Gardiner Rd
- 213 School St
- 580 Quarry St Unit 18
- 98 Pleasant St
- 159 Willard St Unit 7
- 30 Elmwood Park
- 73 Pleasant St Unit 73
- 40 Shirley St
- 403405 Reedsdale Rd
- 196 Canton Ave
- 147 Canton Ave
- 33 Bishop Rd Unit 33
- 88 Wharf St Unit 607
- 88 Wharf St Unit 604
- 12 Hillcrest Rd
- 14 Hillcrest Rd
- 10 Hillcrest Rd
- 578 Pleasant St
- 580 Pleasant St
- 16 Hillcrest Rd
- 574 Pleasant St
- 584 Pleasant St
- 11 Hillcrest Rd
- 570 Pleasant St
- 18 Hillcrest Rd
- 15 Hillcrest Rd
- 15 Hillcrest Rd Unit 1
- 6 Hillcrest Rd
- 564 Pleasant St
- 22 Hillcrest Rd
- 1093 Brook Rd
- 594 Pleasant St
- 4 Hillcrest Rd
- 1089 Brook Rd
Ask me questions while you tour the home.