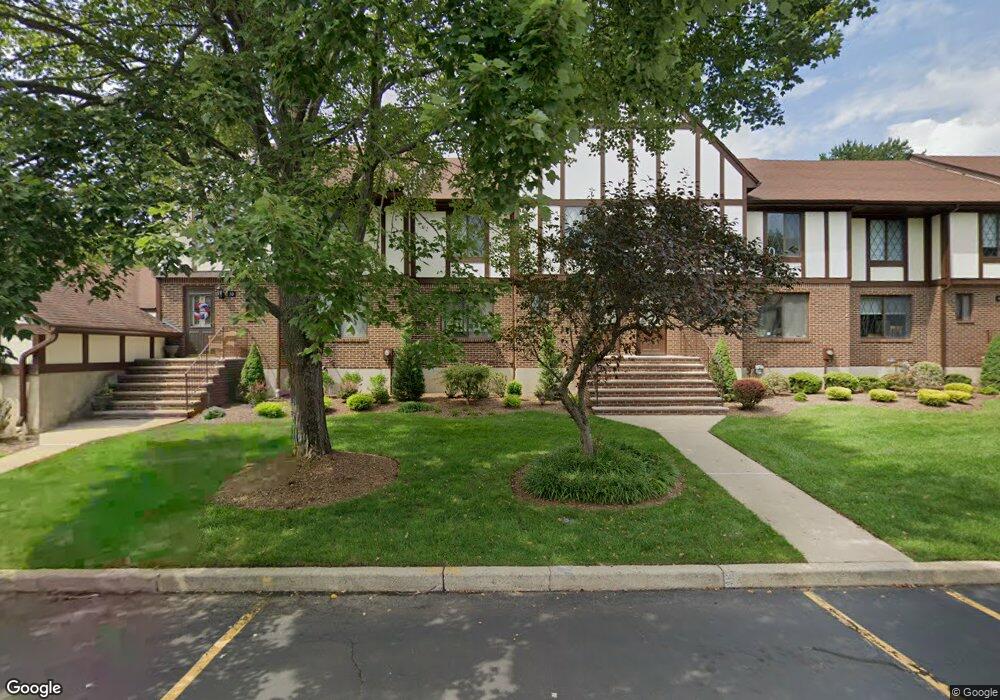
8 Holiday Ct Westwood, NJ 07675
Estimated Value: $658,000 - $710,343
3
Beds
3
Baths
1,956
Sq Ft
$347/Sq Ft
Est. Value
About This Home
This home is located at 8 Holiday Ct, Westwood, NJ 07675 and is currently estimated at $679,336, approximately $347 per square foot. 8 Holiday Ct is a home located in Bergen County with nearby schools including Pascack Valley High School and St. John's Academy.
Ownership History
Date
Name
Owned For
Owner Type
Purchase Details
Closed on
Sep 2, 2022
Sold by
Capawana April
Bought by
Holiday Court Realty Trust
Current Estimated Value
Purchase Details
Closed on
Jun 10, 2021
Sold by
Ymb Management Llc
Bought by
Capawana April
Home Financials for this Owner
Home Financials are based on the most recent Mortgage that was taken out on this home.
Original Mortgage
$388,000
Interest Rate
2.93%
Mortgage Type
Credit Line Revolving
Purchase Details
Closed on
Jan 29, 2019
Sold by
Feinberg Margi and Feinberg Laurence L
Bought by
Fifth Third Mortgage Co
Purchase Details
Closed on
Oct 3, 2006
Sold by
Sadowsky Carol
Bought by
Feinberg Laurence L and Feinberg Margi
Home Financials for this Owner
Home Financials are based on the most recent Mortgage that was taken out on this home.
Original Mortgage
$290,000
Interest Rate
6.49%
Create a Home Valuation Report for This Property
The Home Valuation Report is an in-depth analysis detailing your home's value as well as a comparison with similar homes in the area
Home Values in the Area
Average Home Value in this Area
Purchase History
| Date | Buyer | Sale Price | Title Company |
|---|---|---|---|
| Holiday Court Realty Trust | -- | None Listed On Document | |
| Holiday Court Realty Trust | -- | None Listed On Document | |
| Capawana April | $485,000 | Ardent Title | |
| Capawana April | $485,000 | Ardent Title | |
| Fifth Third Mortgage Co | -- | -- | |
| Feinberg Laurence L | $495,000 | -- |
Source: Public Records
Mortgage History
| Date | Status | Borrower | Loan Amount |
|---|---|---|---|
| Previous Owner | Capawana April | $388,000 | |
| Previous Owner | Feinberg Laurence L | $290,000 |
Source: Public Records
Tax History Compared to Growth
Tax History
| Year | Tax Paid | Tax Assessment Tax Assessment Total Assessment is a certain percentage of the fair market value that is determined by local assessors to be the total taxable value of land and additions on the property. | Land | Improvement |
|---|---|---|---|---|
| 2025 | $11,427 | $418,400 | $225,000 | $193,400 |
| 2024 | $11,355 | $418,400 | $225,000 | $193,400 |
| 2023 | $11,067 | $418,400 | $225,000 | $193,400 |
| 2022 | $11,067 | $418,400 | $225,000 | $193,400 |
| 2021 | $10,807 | $418,400 | $225,000 | $193,400 |
| 2020 | $10,933 | $418,400 | $225,000 | $193,400 |
| 2019 | $10,682 | $418,400 | $225,000 | $193,400 |
| 2018 | $10,565 | $418,400 | $225,000 | $193,400 |
| 2017 | $10,410 | $418,400 | $225,000 | $193,400 |
| 2016 | $10,113 | $418,400 | $225,000 | $193,400 |
| 2015 | $9,824 | $418,400 | $225,000 | $193,400 |
| 2014 | $9,506 | $418,400 | $225,000 | $193,400 |
Source: Public Records
Map
Nearby Homes
- 410 Mark Ln
- 6 Augusta Way
- 8 Augusta Way
- 23 Muirfield Ln
- 458 Cedar Ln
- 21 Muirfield Ln
- 87 Woodmont Cir
- 521 Piermont Ave S Unit 428A
- 521 Piermont Ave S Unit 417A
- 13 Royal Birkdale Ln
- 4 Royal Birkdale Ct
- 25 Muirfield Ln
- Balmore Plan at The Fairways at Edgewood - Carriages Collection
- 179 Woodmont Cir
- 7 Edgewood Ct
- 30 Homestead St
- 7 & 11 Stokes Farm Rd
- 562 Baylor Ave
- 9 Appeld Ct
- 404 Old Tappan Rd
- 10 Holiday Ct
- 6 Holiday Ct
- 4 Holiday Ct
- 2 Holiday Ct Unit 2T
- 14 Holiday Ct
- 16 Holiday Ct
- 18 Holiday Ct
- 9 Holiday Ct
- 13 Holiday Ct
- 11 Holiday Ct
- 3 Holiday Ct
- 7 Holiday Ct
- 7 Holiday Ct Unit T007
- 20 Holiday Ct
- 5 Holiday Ct
- 1 Holiday Ct
- 24 Holiday Ct
- 21 Holiday Ct Unit 21T
- 489 Piermont Ave S
- 496 Piermont Ave S