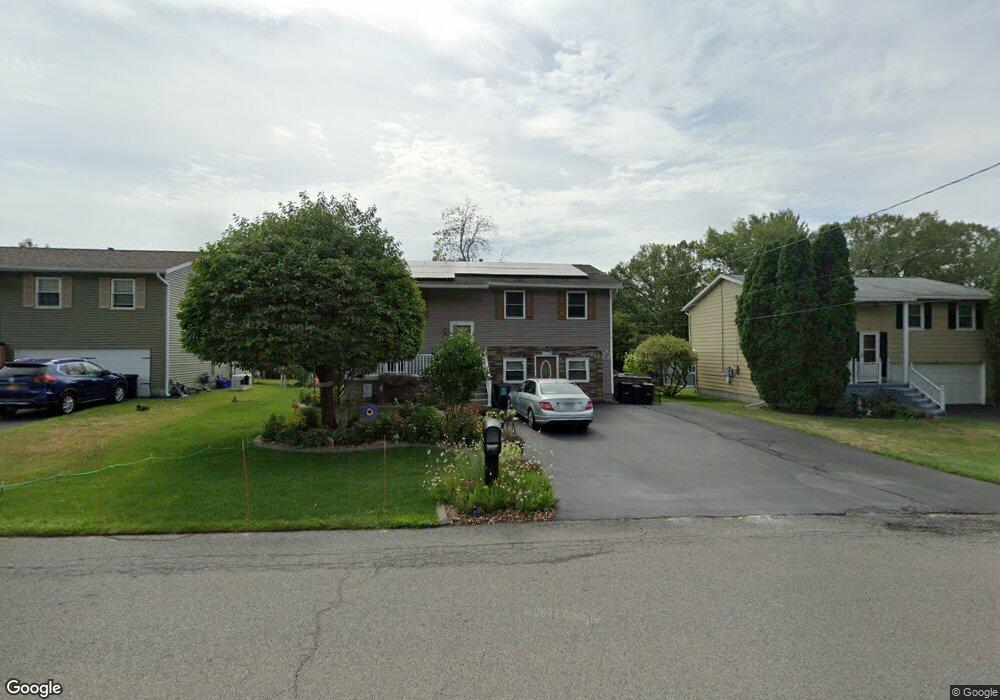
8 Holly Blvd Schenectady, NY 12302
Estimated Value: $293,000 - $326,000
3
Beds
2
Baths
1,368
Sq Ft
$226/Sq Ft
Est. Value
About This Home
This home is located at 8 Holly Blvd, Schenectady, NY 12302 and is currently estimated at $309,028, approximately $225 per square foot. 8 Holly Blvd is a home located in Schenectady County with nearby schools including Scotia Glenville Senior High School, Mekeel Christian Academy, and Oak Hill School.
Ownership History
Date
Name
Owned For
Owner Type
Purchase Details
Closed on
Aug 24, 2009
Sold by
Story Kimberly A
Bought by
Carmichael Thomas R
Current Estimated Value
Home Financials for this Owner
Home Financials are based on the most recent Mortgage that was taken out on this home.
Original Mortgage
$161,500
Outstanding Balance
$104,220
Interest Rate
5.17%
Mortgage Type
New Conventional
Estimated Equity
$204,808
Purchase Details
Closed on
Aug 21, 2009
Sold by
Story Kimberly A and Proulx Kimberly A
Bought by
Carmichael Thomas R and Carmichael Denise M
Home Financials for this Owner
Home Financials are based on the most recent Mortgage that was taken out on this home.
Original Mortgage
$161,500
Outstanding Balance
$104,220
Interest Rate
5.17%
Mortgage Type
New Conventional
Estimated Equity
$204,808
Create a Home Valuation Report for This Property
The Home Valuation Report is an in-depth analysis detailing your home's value as well as a comparison with similar homes in the area
Home Values in the Area
Average Home Value in this Area
Purchase History
| Date | Buyer | Sale Price | Title Company |
|---|---|---|---|
| Carmichael Thomas R | $186,500 | Gary J Oconnor | |
| Carmichael Thomas R | $187,000 | None Available |
Source: Public Records
Mortgage History
| Date | Status | Borrower | Loan Amount |
|---|---|---|---|
| Open | Carmichael Thomas R | $161,500 |
Source: Public Records
Tax History
| Year | Tax Paid | Tax Assessment Tax Assessment Total Assessment is a certain percentage of the fair market value that is determined by local assessors to be the total taxable value of land and additions on the property. | Land | Improvement |
|---|---|---|---|---|
| 2024 | -- | $148,600 | $24,200 | $124,400 |
| 2023 | $1,285 | $148,600 | $24,200 | $124,400 |
| 2022 | $2,246 | $148,600 | $24,200 | $124,400 |
| 2021 | $5,802 | $148,600 | $24,200 | $124,400 |
| 2020 | $2,933 | $148,600 | $24,200 | $124,400 |
| 2019 | $1,953 | $148,600 | $24,200 | $124,400 |
| 2018 | $5,802 | $148,600 | $24,200 | $124,400 |
| 2017 | $5,802 | $148,600 | $24,200 | $124,400 |
| 2016 | $5,802 | $148,600 | $24,200 | $124,400 |
| 2015 | -- | $148,600 | $24,200 | $124,400 |
| 2014 | -- | $148,600 | $24,200 | $124,400 |
Source: Public Records
Map
Nearby Homes
- 25 Cartwheel Dr
- 16 Red Oak Dr
- 44 Bancker Ave
- L18 Market St
- 11 Halcyon St
- 22 Heatherington St
- 37 Marion Blvd
- 36 Marion Blvd
- 337 N Ballston Ave
- L1 Sacandaga Rd
- 205 Vley Rd
- 174 6th St
- 210 3rd St
- 223 4th St
- 11 Washington Rd
- 0 Sacandaga Rd Unit 11523192
- 0 Sacandaga Rd Unit 23971233
- 205 3rd St
- 127 N Toll St
- 223 Broad St
Your Personal Tour Guide
Ask me questions while you tour the home.