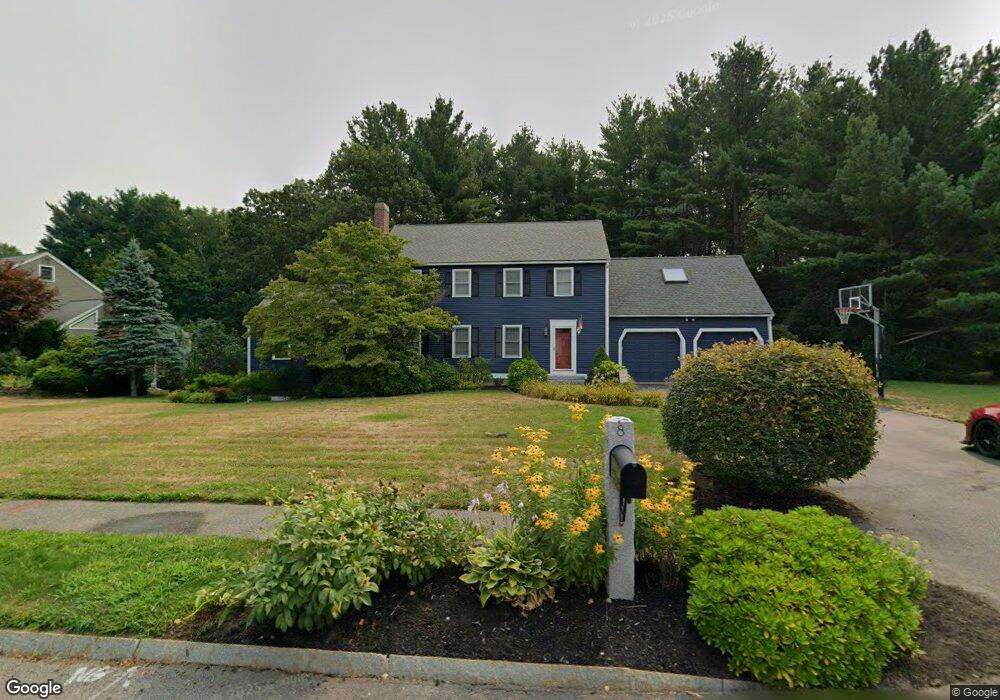
8 Honeysuckle Rd Westford, MA 01886
Estimated Value: $1,002,000 - $1,214,000
4
Beds
3
Baths
2,636
Sq Ft
$404/Sq Ft
Est. Value
About This Home
This home is located at 8 Honeysuckle Rd, Westford, MA 01886 and is currently estimated at $1,064,010, approximately $403 per square foot. 8 Honeysuckle Rd is a home located in Middlesex County with nearby schools including Col John Robinson, John A. Crisafulli Elementary School, and Blanchard Middle School.
Ownership History
Date
Name
Owned For
Owner Type
Purchase Details
Closed on
Apr 29, 2024
Sold by
Cipriano Joseph R and Cipriano Jodi R
Bought by
Cipriano Ft and Cipriano
Current Estimated Value
Purchase Details
Closed on
Jun 11, 2004
Sold by
Norman Douglas O and Norman Janice B
Bought by
Cipriano Joseph R and Cipriano Jodi R
Home Financials for this Owner
Home Financials are based on the most recent Mortgage that was taken out on this home.
Original Mortgage
$333,000
Interest Rate
5.99%
Mortgage Type
Purchase Money Mortgage
Purchase Details
Closed on
Oct 15, 1992
Sold by
Hitchin Post Greens
Bought by
Norman Douglas O and Norman Janice
Home Financials for this Owner
Home Financials are based on the most recent Mortgage that was taken out on this home.
Original Mortgage
$189,650
Interest Rate
7.93%
Mortgage Type
Purchase Money Mortgage
Create a Home Valuation Report for This Property
The Home Valuation Report is an in-depth analysis detailing your home's value as well as a comparison with similar homes in the area
Home Values in the Area
Average Home Value in this Area
Purchase History
| Date | Buyer | Sale Price | Title Company |
|---|---|---|---|
| Cipriano Ft | -- | None Available | |
| Cipriano Ft | -- | None Available | |
| Cipriano Joseph R | $515,000 | -- | |
| Cipriano Joseph R | $515,000 | -- | |
| Norman Douglas O | $210,750 | -- | |
| Norman Douglas O | $210,750 | -- |
Source: Public Records
Mortgage History
| Date | Status | Borrower | Loan Amount |
|---|---|---|---|
| Previous Owner | Norman Douglas O | $308,300 | |
| Previous Owner | Cipriano Joseph R | $333,000 | |
| Previous Owner | Norman Douglas O | $300,000 | |
| Previous Owner | Norman Douglas O | $189,650 |
Source: Public Records
Tax History Compared to Growth
Tax History
| Year | Tax Paid | Tax Assessment Tax Assessment Total Assessment is a certain percentage of the fair market value that is determined by local assessors to be the total taxable value of land and additions on the property. | Land | Improvement |
|---|---|---|---|---|
| 2025 | $11,589 | $841,600 | $0 | $841,600 |
| 2024 | $11,589 | $841,600 | $0 | $841,600 |
| 2023 | $11,017 | $746,400 | $0 | $746,400 |
| 2022 | $11,848 | $735,000 | $0 | $735,000 |
| 2021 | $11,164 | $670,900 | $0 | $670,900 |
| 2020 | $10,206 | $625,000 | $0 | $625,000 |
| 2019 | $10,454 | $631,300 | $0 | $631,300 |
| 2018 | $9,270 | $572,900 | $0 | $572,900 |
| 2017 | $8,796 | $536,000 | $0 | $536,000 |
| 2016 | $8,786 | $539,000 | $0 | $539,000 |
| 2015 | $8,536 | $525,600 | $0 | $525,600 |
| 2014 | $8,546 | $514,800 | $0 | $514,800 |
Source: Public Records
Map
Nearby Homes
- 1 Thistle Ln
- 4 Casie Ln
- 1 Courtney Ln
- 8 Sandy Beach Rd
- 5 Colonel Rolls Dr
- 20 Dean Ln Unit 20
- 115 Goldsmith St
- 66 Patten Rd
- 25 Laurel Rd
- 150 Goldsmith St
- 336 King St Unit 105
- 38 George St
- 16 Abbot St
- 54 Orchid Dr
- 14 Banbury Dr
- 16 Main St Unit 2
- 28 Graniteville Rd
- 17 Hartwell Ave
- 4 Powers Rd
- 20 Murray Park Rd
- 2 Thistle Ln
- 6 Honeysuckle Rd
- 7 Honeysuckle Rd
- 5 Honeysuckle Rd
- 9 Honeysuckle Rd
- 4 Honeysuckle Rd
- 3 Thistle Ln
- 6 Magnolia Dr
- 6 Thistle Ln
- 11 Honeysuckle Rd
- 8 Thistle Ln
- 8 Magnolia Dr
- 14 Honeysuckle Rd
- 5 Thistle Ln
- 2 Honeysuckle Rd
- 4 Wintergreen Ln
- 10 Thistle Ln
- 13 Honeysuckle Rd
- 2 Wintergreen Ln
- 9 Thistle Ln