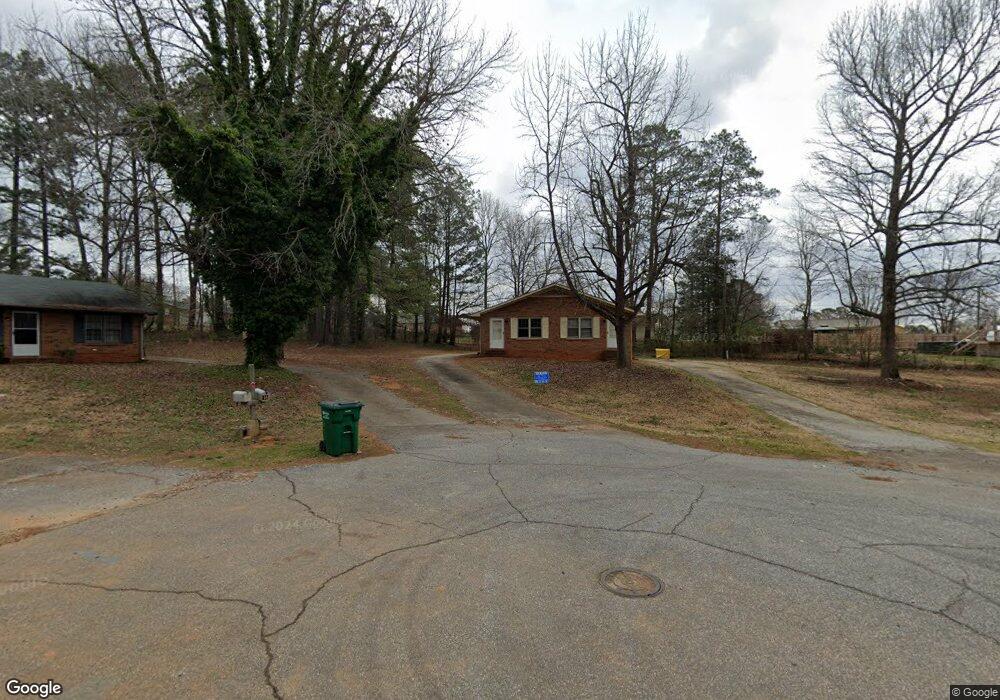
8 Idlewood Ct Unit 10 Spartanburg, SC 29307
Estimated Value: $161,715 - $198,000
3
Beds
2
Baths
1,320
Sq Ft
$136/Sq Ft
Est. Value
About This Home
This home is located at 8 Idlewood Ct Unit 10, Spartanburg, SC 29307 and is currently estimated at $179,179, approximately $135 per square foot. 8 Idlewood Ct Unit 10 is a home located in Spartanburg County with nearby schools including Broome High School, Spartanburg Day School, and St. Paul The Apostle Catholic School.
Ownership History
Date
Name
Owned For
Owner Type
Purchase Details
Closed on
Oct 1, 2021
Sold by
K & S Upstate Investments Llc
Bought by
Martingale Holdings Llc
Current Estimated Value
Home Financials for this Owner
Home Financials are based on the most recent Mortgage that was taken out on this home.
Original Mortgage
$122,400
Outstanding Balance
$111,718
Interest Rate
3.01%
Mortgage Type
Future Advance Clause Open End Mortgage
Estimated Equity
$67,461
Purchase Details
Closed on
May 26, 2005
Sold by
Watts Kenneth L and Turner Watts Sheryl
Bought by
K & S Upstate Investments Llc
Purchase Details
Closed on
Mar 22, 2005
Sold by
K & S Upstate Investments Llc
Bought by
Watts Kenneth L and Turner Watts Sheryl
Purchase Details
Closed on
Feb 23, 2004
Sold by
Watts Kenneth L and Watts Sheryl T
Bought by
K & S Upstate Investments Llc
Create a Home Valuation Report for This Property
The Home Valuation Report is an in-depth analysis detailing your home's value as well as a comparison with similar homes in the area
Home Values in the Area
Average Home Value in this Area
Purchase History
| Date | Buyer | Sale Price | Title Company |
|---|---|---|---|
| Martingale Holdings Llc | $1,175,000 | None Available | |
| K & S Upstate Investments Llc | -- | -- | |
| Watts Kenneth L | $115,000 | -- | |
| K & S Upstate Investments Llc | -- | Merestone Title |
Source: Public Records
Mortgage History
| Date | Status | Borrower | Loan Amount |
|---|---|---|---|
| Open | Martingale Holdings Llc | $122,400 |
Source: Public Records
Tax History Compared to Growth
Tax History
| Year | Tax Paid | Tax Assessment Tax Assessment Total Assessment is a certain percentage of the fair market value that is determined by local assessors to be the total taxable value of land and additions on the property. | Land | Improvement |
|---|---|---|---|---|
| 2025 | $2,878 | $6,312 | $1,284 | $5,028 |
| 2024 | $2,878 | $6,312 | $1,284 | $5,028 |
| 2023 | $2,878 | $6,312 | $1,284 | $5,028 |
| 2022 | $3,163 | $6,600 | $960 | $5,640 |
| 2021 | $2,085 | $4,278 | $960 | $3,318 |
| 2020 | $2,063 | $4,278 | $960 | $3,318 |
| 2019 | $2,181 | $4,278 | $960 | $3,318 |
| 2018 | $2,420 | $5,247 | $792 | $4,455 |
| 2017 | $2,055 | $4,542 | $683 | $3,859 |
| 2016 | $2,055 | $4,542 | $683 | $3,859 |
| 2015 | $2,038 | $4,542 | $683 | $3,859 |
| 2014 | $2,028 | $4,542 | $683 | $3,859 |
Source: Public Records
Map
Nearby Homes
- 655 Idlewood Cir
- 230 Idlewood Cir
- 241 Idlewood Cir
- 249 Leeds Ln
- 250 Leeds Ln
- 270 Leeds Ln
- 204 Bennett Dairy Rd
- Nassau Cove Plan at Berkeley - Villas
- 215 Penny Bennett Rd
- 4026 Mancini Rd
- 268 Saranac Dr
- 276 Saranac Dr
- 4420 Duparc Way
- Bramante Ranch Plan at Berkeley
- York Plan at Berkeley
- Lehigh Plan at Berkeley
- Palladio Ranch Plan at Berkeley
- Hudson Plan at Berkeley
- Columbia Plan at Berkeley
- 9015 Margot Place
- 14 Idlewood Ct Unit 16
- 109 Placid Place
- 113 Placid Place
- 2 Idlewood Ct Unit 6
- 720 Idlewood Cir
- 122 Idlewood Cir
- 105 Placid Place
- 118 Idlewood Cir
- 117 Placid Place
- 20 Idlewood Ct
- 20A Idlewood Ct Unit 20B
- 126 Idlewood Cir
- 114 Idlewood Cir
- 738 Idlewood Cir Unit 738
- 101 Placid Place
- 108 Idlewood Cir
- 106 Idlewood Cir
- 104 Idlewood Cir
- 744 Idlewood Cir
- 110 Placid Place