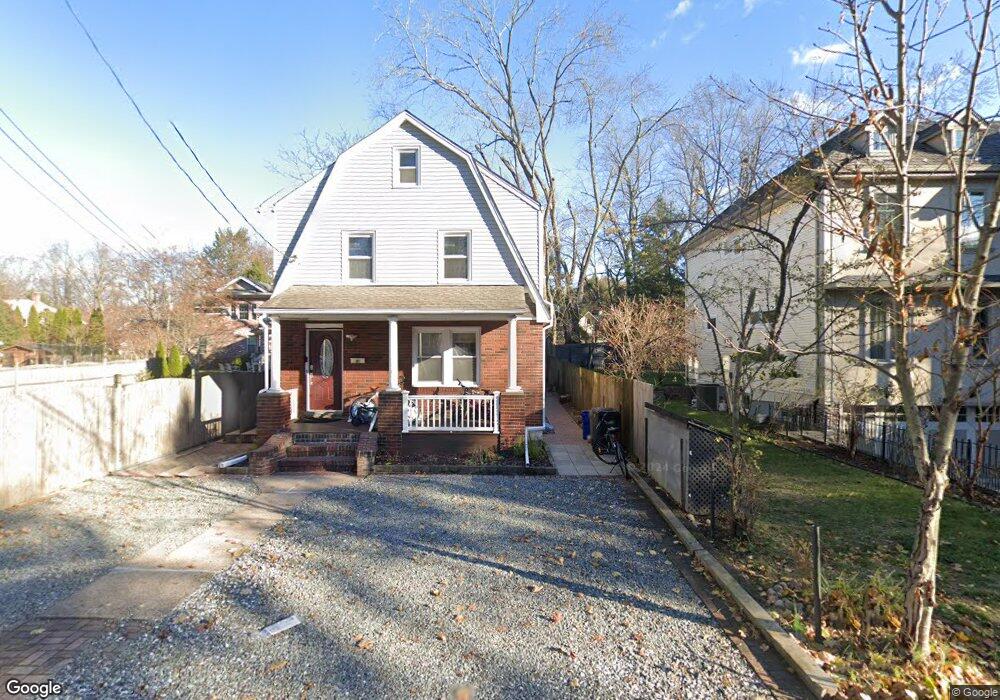
8 Insley St Demarest, NJ 07627
Estimated Value: $816,000 - $902,000
3
Beds
2
Baths
1,840
Sq Ft
$473/Sq Ft
Est. Value
About This Home
This home is located at 8 Insley St, Demarest, NJ 07627 and is currently estimated at $869,909, approximately $472 per square foot. 8 Insley St is a home located in Bergen County with nearby schools including County Road Elementary School, Luther Lee Emerson Elementary School, and Demarest Middle School.
Ownership History
Date
Name
Owned For
Owner Type
Purchase Details
Closed on
Sep 6, 2017
Sold by
Hwang Young Ah and Hwang Chul Kyu
Bought by
Kwon Kihyun and Hwang Eui J
Current Estimated Value
Home Financials for this Owner
Home Financials are based on the most recent Mortgage that was taken out on this home.
Original Mortgage
$320,625
Outstanding Balance
$221,214
Interest Rate
3.9%
Mortgage Type
New Conventional
Estimated Equity
$648,695
Purchase Details
Closed on
May 2, 2006
Sold by
Dam Lee
Bought by
Hwang Chul Kyu and Hwang Young Ah
Home Financials for this Owner
Home Financials are based on the most recent Mortgage that was taken out on this home.
Original Mortgage
$367,500
Interest Rate
6.34%
Purchase Details
Closed on
Aug 22, 1996
Sold by
Conti Steven J and Wilmot Jo Ann
Bought by
Dam Lee and Lee Keunhee
Home Financials for this Owner
Home Financials are based on the most recent Mortgage that was taken out on this home.
Original Mortgage
$153,000
Interest Rate
8.1%
Create a Home Valuation Report for This Property
The Home Valuation Report is an in-depth analysis detailing your home's value as well as a comparison with similar homes in the area
Home Values in the Area
Average Home Value in this Area
Purchase History
| Date | Buyer | Sale Price | Title Company |
|---|---|---|---|
| Kwon Kihyun | $427,500 | Hudson One Title | |
| Hwang Chul Kyu | $490,000 | -- | |
| Dam Lee | $205,000 | -- |
Source: Public Records
Mortgage History
| Date | Status | Borrower | Loan Amount |
|---|---|---|---|
| Open | Kwon Kihyun | $320,625 | |
| Previous Owner | Hwang Chul Kyu | $367,500 | |
| Previous Owner | Dam Lee | $153,000 |
Source: Public Records
Tax History
| Year | Tax Paid | Tax Assessment Tax Assessment Total Assessment is a certain percentage of the fair market value that is determined by local assessors to be the total taxable value of land and additions on the property. | Land | Improvement |
|---|---|---|---|---|
| 2025 | $11,742 | $779,100 | $476,300 | $302,800 |
| 2024 | $11,208 | $384,100 | $246,200 | $137,900 |
| 2023 | $10,905 | $384,100 | $246,200 | $137,900 |
| 2022 | $10,905 | $384,100 | $246,200 | $137,900 |
| 2021 | $10,636 | $384,100 | $246,200 | $137,900 |
| 2020 | $10,386 | $384,100 | $246,200 | $137,900 |
| 2019 | $10,086 | $384,100 | $246,200 | $137,900 |
| 2018 | $9,419 | $370,100 | $246,200 | $123,900 |
| 2017 | $9,193 | $370,100 | $246,200 | $123,900 |
| 2016 | $9,049 | $370,100 | $246,200 | $123,900 |
| 2015 | $8,927 | $370,100 | $246,200 | $123,900 |
| 2014 | $8,734 | $370,100 | $246,200 | $123,900 |
Source: Public Records
Map
Nearby Homes
- 39 Drury Ln
- 31 Madison Ave
- 106 Prescott St
- 232 County Rd
- 589 Piermont Rd
- 22 Northwood Ave
- 41 Orchard Rd
- 3 Central Ave
- 7 Central Ave
- 44 Orchard Rd
- 199 Whitman St
- 11 Stone Bridge Ct
- 24 Stone Bridge Ct
- 2 Stone Bridge Ct
- 40 County Rd
- 44 Pine Terrace
- 65 Prospect Ave
- 25 Maple Ave
- 351 Closter Dock Rd
- 214 Durie Ave
Your Personal Tour Guide
Ask me questions while you tour the home.