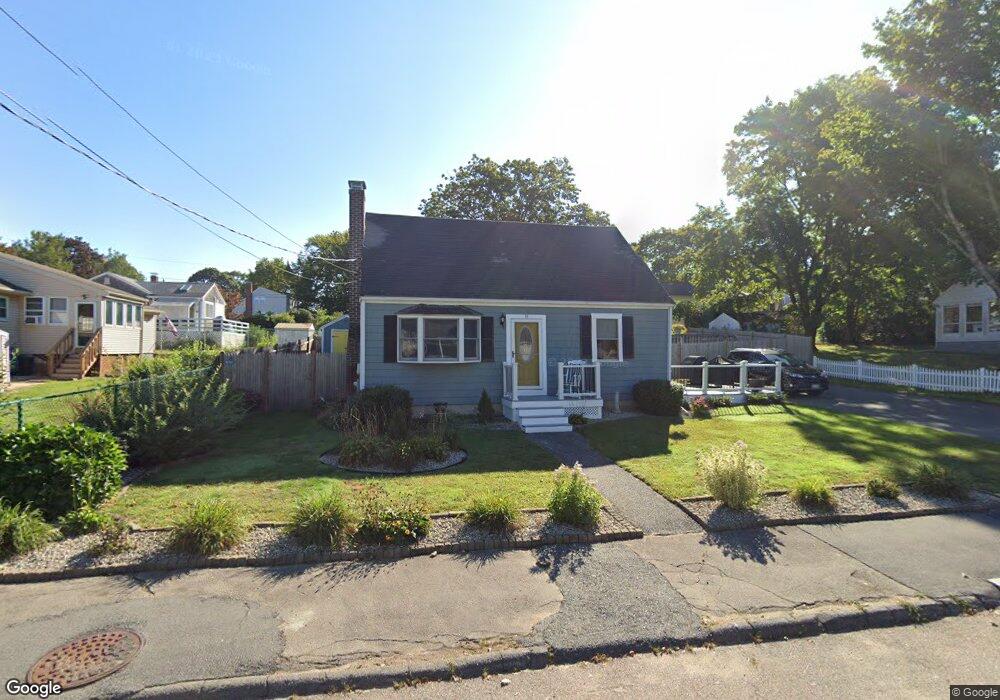
8 Isabelle Ave Holbrook, MA 02343
Estimated Value: $572,000 - $642,000
4
Beds
2
Baths
1,764
Sq Ft
$340/Sq Ft
Est. Value
About This Home
This home is located at 8 Isabelle Ave, Holbrook, MA 02343 and is currently estimated at $599,686, approximately $339 per square foot. 8 Isabelle Ave is a home located in Norfolk County with nearby schools including John F. Kennedy Elementary School, Holbrook Middle High School, and Boston Higashi School.
Ownership History
Date
Name
Owned For
Owner Type
Purchase Details
Closed on
Feb 17, 1989
Sold by
Mceleney Daniel J
Bought by
Lynch Timothy P
Current Estimated Value
Home Financials for this Owner
Home Financials are based on the most recent Mortgage that was taken out on this home.
Original Mortgage
$128,000
Interest Rate
10.77%
Mortgage Type
Purchase Money Mortgage
Create a Home Valuation Report for This Property
The Home Valuation Report is an in-depth analysis detailing your home's value as well as a comparison with similar homes in the area
Home Values in the Area
Average Home Value in this Area
Purchase History
| Date | Buyer | Sale Price | Title Company |
|---|---|---|---|
| Lynch Timothy P | $143,000 | -- | |
| Lynch Timothy P | $143,000 | -- |
Source: Public Records
Mortgage History
| Date | Status | Borrower | Loan Amount |
|---|---|---|---|
| Open | Lynch Timothy P | $220,000 | |
| Closed | Lynch Timothy P | $114,000 | |
| Closed | Lynch Timothy P | $128,000 |
Source: Public Records
Tax History Compared to Growth
Tax History
| Year | Tax Paid | Tax Assessment Tax Assessment Total Assessment is a certain percentage of the fair market value that is determined by local assessors to be the total taxable value of land and additions on the property. | Land | Improvement |
|---|---|---|---|---|
| 2025 | $65 | $496,500 | $222,200 | $274,300 |
| 2024 | $6,415 | $477,300 | $208,700 | $268,600 |
| 2023 | $6,716 | $436,700 | $183,700 | $253,000 |
| 2022 | $6,007 | $364,300 | $159,700 | $204,600 |
| 2021 | $5,798 | $336,700 | $149,300 | $187,400 |
| 2020 | $5,829 | $317,300 | $144,900 | $172,400 |
| 2019 | $5,830 | $299,600 | $135,400 | $164,200 |
| 2018 | $5,988 | $289,700 | $131,500 | $158,200 |
| 2017 | $5,628 | $269,300 | $120,100 | $149,200 |
| 2016 | $4,818 | $245,300 | $99,100 | $146,200 |
| 2015 | $4,551 | $238,500 | $95,300 | $143,200 |
| 2014 | $4,477 | $238,500 | $95,300 | $143,200 |
Source: Public Records
Map
Nearby Homes
- 96 Roberts Ave
- 7 Morton Rd
- 28 Wilmarth Rd
- 5 Clarendon Cir Unit Lot 4
- 217 Mill St
- 9 Tucker Terrace
- 327 Union St
- 14 Alfred Terrace
- 10 Alfred Terrace
- 89 Fernandez Cir
- 27 Winter St
- 6 Dayle Cir
- 346 South St
- 240 South St
- 148 N Franklin St
- 17 Mill St
- 5 Nightingale Cir
- 373 N Franklin St
- 15 Howard St
- 53 Cochato Park