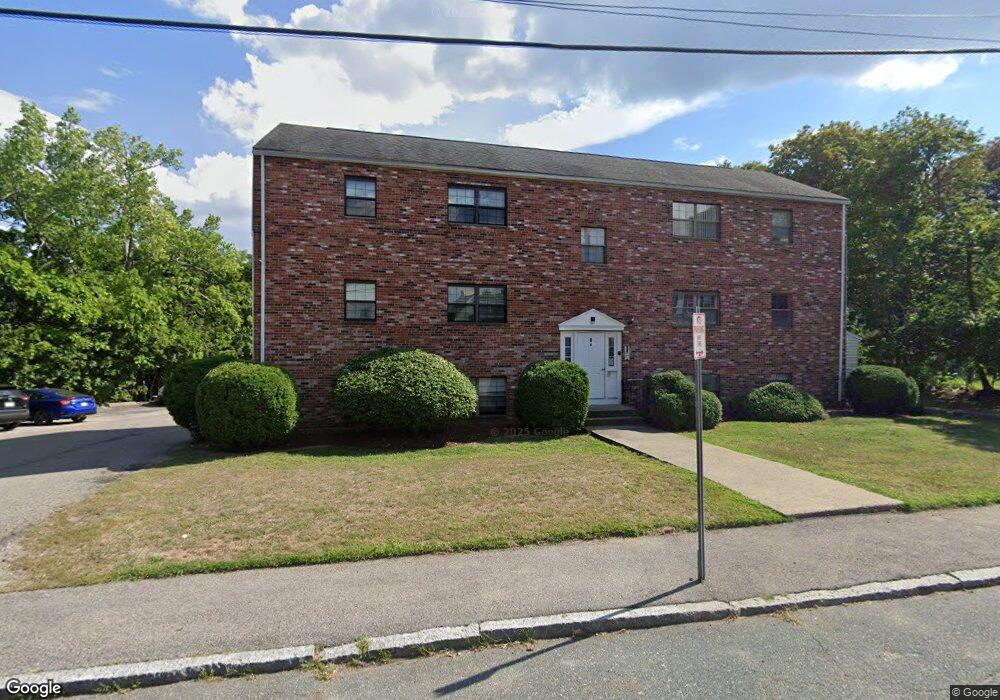
8 Jackson St Unit A2 Quincy, MA 02169
South Quincy NeighborhoodEstimated Value: $304,000 - $395,000
2
Beds
1
Bath
610
Sq Ft
$541/Sq Ft
Est. Value
About This Home
This home is located at 8 Jackson St Unit A2, Quincy, MA 02169 and is currently estimated at $330,281, approximately $541 per square foot. 8 Jackson St Unit A2 is a home located in Norfolk County with nearby schools including Lincoln-Hancock Community School, South West Middle School, and Quincy High School.
Ownership History
Date
Name
Owned For
Owner Type
Purchase Details
Closed on
Jan 26, 2007
Sold by
Zou Che Q and Zou Yi
Bought by
Hinkley David R
Current Estimated Value
Home Financials for this Owner
Home Financials are based on the most recent Mortgage that was taken out on this home.
Original Mortgage
$106,000
Outstanding Balance
$63,454
Interest Rate
6.15%
Mortgage Type
Purchase Money Mortgage
Estimated Equity
$266,827
Purchase Details
Closed on
Sep 30, 1997
Sold by
Chu Ft
Bought by
Zou Yi and Zou Che Q
Create a Home Valuation Report for This Property
The Home Valuation Report is an in-depth analysis detailing your home's value as well as a comparison with similar homes in the area
Home Values in the Area
Average Home Value in this Area
Purchase History
| Date | Buyer | Sale Price | Title Company |
|---|---|---|---|
| Hinkley David R | $163,000 | -- | |
| Zou Yi | $46,000 | -- |
Source: Public Records
Mortgage History
| Date | Status | Borrower | Loan Amount |
|---|---|---|---|
| Open | Hinkley David R | $106,000 |
Source: Public Records
Tax History Compared to Growth
Tax History
| Year | Tax Paid | Tax Assessment Tax Assessment Total Assessment is a certain percentage of the fair market value that is determined by local assessors to be the total taxable value of land and additions on the property. | Land | Improvement |
|---|---|---|---|---|
| 2025 | $2,987 | $259,100 | $0 | $259,100 |
| 2024 | $2,799 | $248,400 | $0 | $248,400 |
| 2023 | $2,698 | $242,400 | $0 | $242,400 |
| 2022 | $2,818 | $235,200 | $0 | $235,200 |
| 2021 | $2,645 | $217,900 | $0 | $217,900 |
| 2020 | $2,603 | $209,400 | $0 | $209,400 |
| 2019 | $2,033 | $162,000 | $0 | $162,000 |
| 2018 | $2,006 | $150,400 | $0 | $150,400 |
| 2017 | $2,216 | $156,400 | $0 | $156,400 |
| 2016 | $2,200 | $153,200 | $0 | $153,200 |
| 2015 | $2,120 | $145,200 | $0 | $145,200 |
| 2014 | $1,976 | $133,000 | $0 | $133,000 |
Source: Public Records
Map
Nearby Homes
- 8 Jackson St Unit B2
- 33 Brook Rd
- 94 Brook Rd Unit 3
- 5 Pearl St
- 165 Granite St
- 72 Federal Ave
- 83 Madison Ave
- 166 Phipps St
- 76 Scotch Pond Place
- 155 Kendrick Ave Unit T7
- 73 Scotch Pond Place
- 64 Garfield St Unit B
- 18 Cliveden St Unit 406W
- 18 Cliveden St Unit 201W
- 2 Cliveden St Unit 601E
- 215 Thomas Burgin Pkwy Unit 35
- 73 Cranch St Unit 73
- 195 Thomas Burgin Pkwy Unit 205
- 203 Centre St
- 21 Arthur St
- 8 Jackson St Unit 5C
- 8 Jackson St Unit 3
- 8 Jackson St Unit C6
- 8 Jackson St Unit C5
- 8 Jackson St Unit C3
- 8 Jackson St Unit C2
- 8 Jackson St Unit C1
- 8 Jackson St Unit B5
- 8 Jackson St Unit B4
- 8 Jackson St Unit B1
- 8 Jackson St Unit A6
- 8 Jackson St Unit A5
- 8 Jackson St Unit A4
- 8 Jackson St Unit A1
- 8 Jackson St Unit 4
- 8 Jackson St Unit St
- 8 Jackson St Unit B5,B
- 8 Jackson St Unit 1
- 8 Jackson St Unit 8 C5
- 8 Jackson St Unit B6,8