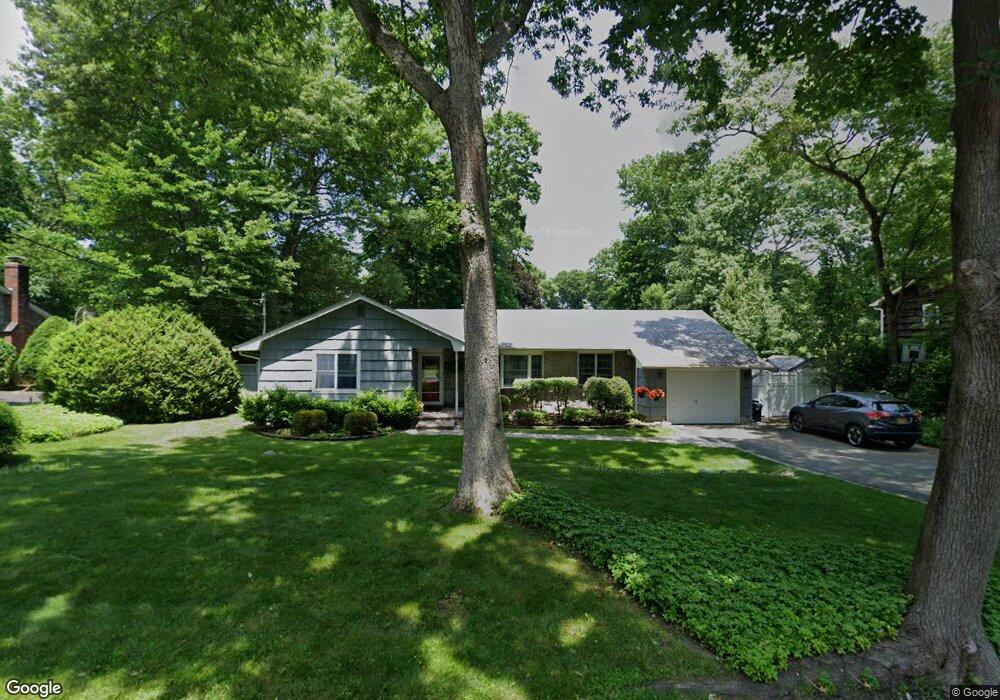
8 John St Shoreham, NY 11786
Estimated Value: $649,000 - $733,000
3
Beds
2
Baths
1,431
Sq Ft
$481/Sq Ft
Est. Value
About This Home
This home is located at 8 John St, Shoreham, NY 11786 and is currently estimated at $688,141, approximately $480 per square foot. 8 John St is a home located in Suffolk County with nearby schools including Miller Avenue School, Wading River School, and Albert G Prodell Middle School.
Ownership History
Date
Name
Owned For
Owner Type
Purchase Details
Closed on
Aug 11, 2003
Sold by
Casey Joseph P and Baker Teresa M
Bought by
Debus Brian and Debus Margaret
Current Estimated Value
Home Financials for this Owner
Home Financials are based on the most recent Mortgage that was taken out on this home.
Original Mortgage
$314,500
Outstanding Balance
$134,756
Interest Rate
5.25%
Mortgage Type
Purchase Money Mortgage
Estimated Equity
$553,385
Purchase Details
Closed on
Mar 12, 1999
Sold by
Higgins Robert and Higgins Laurie
Bought by
Casey Joseph P and Baker Teresa M
Home Financials for this Owner
Home Financials are based on the most recent Mortgage that was taken out on this home.
Original Mortgage
$155,200
Interest Rate
6.74%
Mortgage Type
FHA
Create a Home Valuation Report for This Property
The Home Valuation Report is an in-depth analysis detailing your home's value as well as a comparison with similar homes in the area
Home Values in the Area
Average Home Value in this Area
Purchase History
| Date | Buyer | Sale Price | Title Company |
|---|---|---|---|
| Debus Brian | $350,000 | First Long Island Title | |
| Casey Joseph P | $156,000 | First American Title Ins Co |
Source: Public Records
Mortgage History
| Date | Status | Borrower | Loan Amount |
|---|---|---|---|
| Open | Debus Brian | $314,500 | |
| Previous Owner | Casey Joseph P | $155,200 |
Source: Public Records
Tax History
| Year | Tax Paid | Tax Assessment Tax Assessment Total Assessment is a certain percentage of the fair market value that is determined by local assessors to be the total taxable value of land and additions on the property. | Land | Improvement |
|---|---|---|---|---|
| 2024 | $12,024 | $2,970 | $300 | $2,670 |
| 2023 | $12,024 | $2,970 | $300 | $2,670 |
| 2022 | $9,533 | $2,970 | $300 | $2,670 |
| 2021 | $9,533 | $2,970 | $300 | $2,670 |
| 2020 | $10,717 | $2,970 | $300 | $2,670 |
| 2019 | $10,717 | $0 | $0 | $0 |
| 2018 | $9,307 | $2,970 | $300 | $2,670 |
| 2017 | $9,307 | $2,970 | $300 | $2,670 |
| 2016 | $9,252 | $2,970 | $300 | $2,670 |
| 2015 | -- | $2,970 | $300 | $2,670 |
| 2014 | -- | $2,970 | $300 | $2,670 |
Source: Public Records
Map
Nearby Homes
Your Personal Tour Guide
Ask me questions while you tour the home.