Estimated Value: $210,980 - $238,000
--
Bed
--
Bath
1,445
Sq Ft
$152/Sq Ft
Est. Value
About This Home
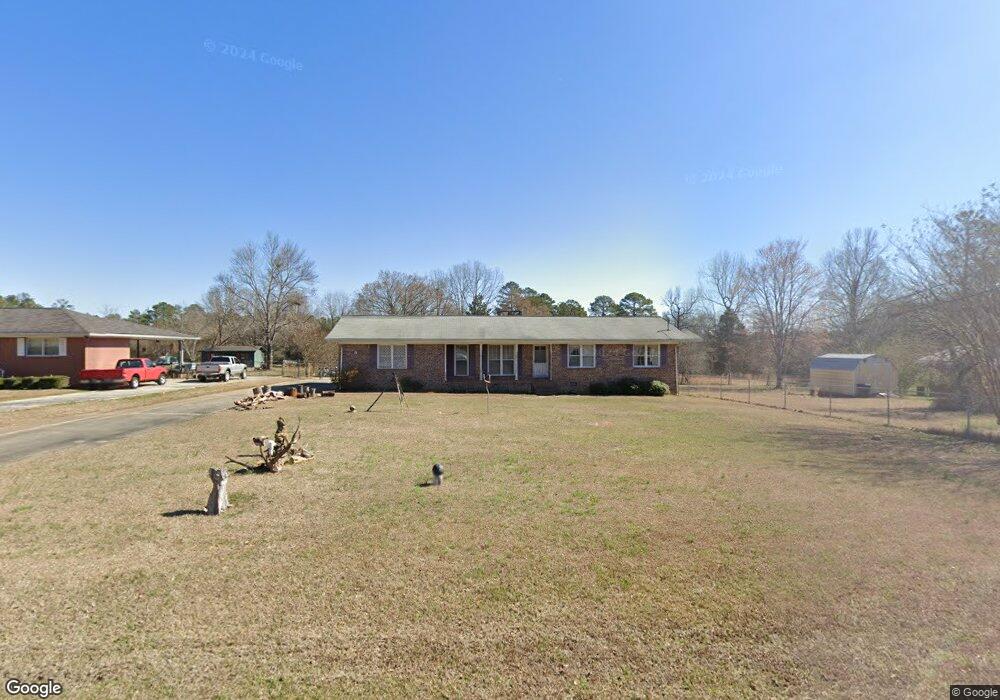
This home is located at 8 Johns Dr NE, Rome, GA 30165 and is currently estimated at $220,245, approximately $152 per square foot. 8 Johns Dr NE is a home located in Floyd County with nearby schools including Armuchee Middle School and Armuchee High School.
Ownership History
Date
Name
Owned For
Owner Type
Purchase Details
Closed on
Jul 17, 2019
Sold by
Womack Dorothy Jean
Bought by
Womack Dorothy Jean and Ledbetter David Ross
Current Estimated Value
Purchase Details
Closed on
Jan 31, 2000
Sold by
Cauthen Nyla Rose
Bought by
Ledbetter Joseph D
Purchase Details
Closed on
Jan 25, 2000
Sold by
Cauthen Nyla Rose and Melisa Cauthen Bower
Bought by
Cauthen Nyla Rose
Purchase Details
Closed on
Jun 19, 1998
Sold by
Melisa Cauthen M and Melisa Cauthen Bowers
Bought by
Cauthen Nyla Rose and Melisa Cauthen
Purchase Details
Closed on
Oct 26, 1989
Sold by
Cauthen Cauthen M H and Cauthen Mrs M H
Bought by
Melisa Cauthen M and Melisa Cauthen Bowers
Purchase Details
Closed on
Mar 16, 1968
Bought by
P and R
Purchase Details
Closed on
Mar 15, 1968
Sold by
Hawkins Mr and Mrs Lawrence R
Bought by
Cauthen Cauthen M H and Cauthen Mrs M H
Purchase Details
Closed on
Dec 29, 1966
Sold by
Woodall E G
Bought by
Hawkins Mr and Mrs Lawrence R
Purchase Details
Closed on
Jan 1, 1960
Bought by
Woodall E G
Create a Home Valuation Report for This Property
The Home Valuation Report is an in-depth analysis detailing your home's value as well as a comparison with similar homes in the area
Home Values in the Area
Average Home Value in this Area
Purchase History
| Date | Buyer | Sale Price | Title Company |
|---|---|---|---|
| Womack Dorothy Jean | -- | -- | |
| Ledbetter Joseph D | $90,500 | -- | |
| Cauthen Nyla Rose | -- | -- | |
| Cauthen Nyla Rose | -- | -- | |
| Melisa Cauthen M | -- | -- | |
| P | -- | -- | |
| Cauthen Cauthen M H | $1,200 | -- | |
| Hawkins Mr | -- | -- | |
| Woodall E G | -- | -- |
Source: Public Records
Tax History Compared to Growth
Tax History
| Year | Tax Paid | Tax Assessment Tax Assessment Total Assessment is a certain percentage of the fair market value that is determined by local assessors to be the total taxable value of land and additions on the property. | Land | Improvement |
|---|---|---|---|---|
| 2024 | $1,120 | $75,022 | $7,480 | $67,542 |
| 2023 | $1,027 | $71,398 | $6,600 | $64,798 |
| 2022 | $872 | $60,538 | $5,280 | $55,258 |
| 2021 | $742 | $52,946 | $5,280 | $47,666 |
| 2020 | $647 | $47,250 | $3,960 | $43,290 |
| 2019 | $422 | $44,230 | $3,960 | $40,270 |
| 2018 | $371 | $41,420 | $3,960 | $37,460 |
| 2017 | $342 | $33,287 | $3,960 | $29,327 |
| 2016 | $357 | $34,520 | $3,960 | $30,560 |
| 2015 | $323 | $34,960 | $3,960 | $31,000 |
| 2014 | $323 | $33,683 | $3,960 | $29,723 |
Source: Public Records
Map
Nearby Homes
- KERRY Plan at Northberry
- BELHAVEN Plan at Northberry
- CALI Plan at Northberry
- ROBIE Plan at Northberry
- ARIA Plan at Northberry
- 29 Coggins Place NE
- 27 Coggins Place NE
- 21 Coggins Place NE
- 15 Coggins Place NE
- 3 Babcock Dr NE
- 13 Coggins Place NE
- 11 Coggins Place NE
- 12 Coggins Place NE
- 9 Coggins Place NE
- 10 Coggins Place NE
- 8 Babcock Dr NE
- 10 Johns Dr NE
- 12 Johns Dr NE
- 34 Johns Dr NE
- 34 Johns Dr NE Unit 43
- 36 Johns Dr NE
- 32 Johns Dr NE
- 9 Johns Dr NE
- 7 Johns Dr NE
- 4 Johns Dr NE
- 4 Johns Dr NE
- 14 Johns Dr NE
- 18 Johns Dr NE
- 38 Johns Dr NE
- 28 Johns Dr NE
- 5 Johns Dr NE
- 13 Johns Dr NE
- 22 Johns Dr NE
- 40 Johns Dr NE
- 3 Johns Dr NE
- 15 Johns Dr NE