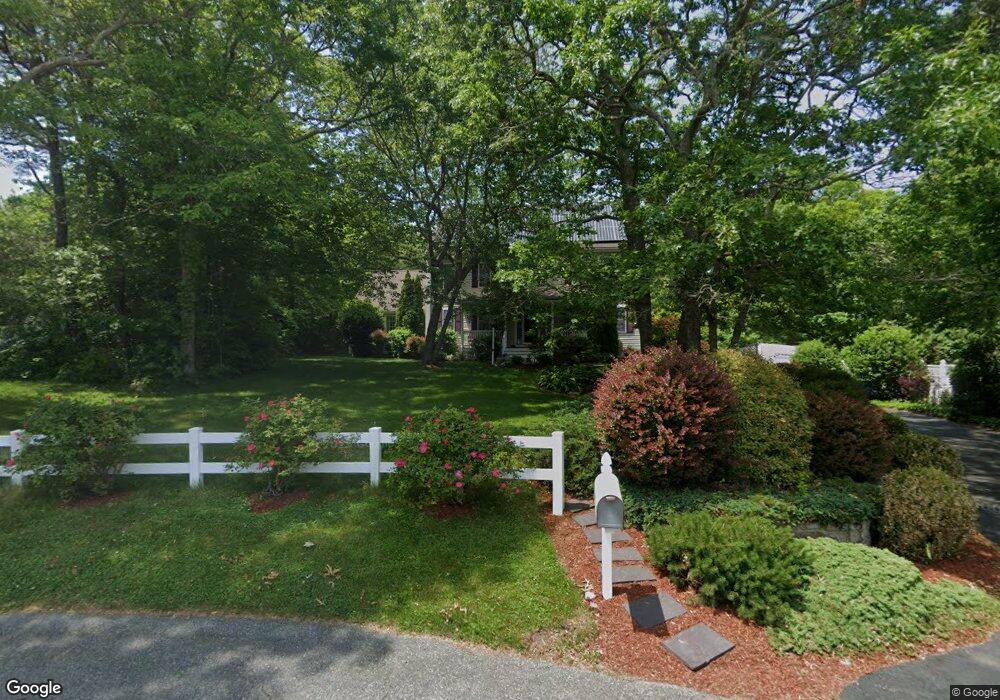
8 Jones Ln Sagamore Beach, MA 02562
Estimated Value: $882,072 - $957,000
4
Beds
3
Baths
3,196
Sq Ft
$288/Sq Ft
Est. Value
About This Home
This home is located at 8 Jones Ln, Sagamore Beach, MA 02562 and is currently estimated at $921,268, approximately $288 per square foot. 8 Jones Ln is a home located in Barnstable County with nearby schools including Bourne High School, New Testament Christian School, and Bridgeview Montessori School.
Ownership History
Date
Name
Owned For
Owner Type
Purchase Details
Closed on
Jan 3, 2000
Sold by
Jones Keith M
Bought by
Fucito Dominick and Demarco Fucito Patsy
Current Estimated Value
Create a Home Valuation Report for This Property
The Home Valuation Report is an in-depth analysis detailing your home's value as well as a comparison with similar homes in the area
Home Values in the Area
Average Home Value in this Area
Purchase History
| Date | Buyer | Sale Price | Title Company |
|---|---|---|---|
| Fucito Dominick | $75,000 | -- |
Source: Public Records
Mortgage History
| Date | Status | Borrower | Loan Amount |
|---|---|---|---|
| Open | Fucito Dominick | $185,500 | |
| Closed | Fucito Dominick | $168,000 | |
| Closed | Fucito Dominick | $217,850 |
Source: Public Records
Tax History Compared to Growth
Tax History
| Year | Tax Paid | Tax Assessment Tax Assessment Total Assessment is a certain percentage of the fair market value that is determined by local assessors to be the total taxable value of land and additions on the property. | Land | Improvement |
|---|---|---|---|---|
| 2025 | $6,421 | $822,200 | $258,600 | $563,600 |
| 2024 | $6,329 | $789,100 | $246,300 | $542,800 |
| 2023 | $6,223 | $706,400 | $218,000 | $488,400 |
| 2022 | $5,890 | $583,700 | $192,900 | $390,800 |
| 2021 | $5,471 | $537,200 | $175,500 | $361,700 |
| 2020 | $6,774 | $529,200 | $173,800 | $355,400 |
| 2019 | $5,403 | $514,100 | $173,800 | $340,300 |
| 2018 | $6,140 | $497,200 | $165,600 | $331,600 |
| 2017 | $4,988 | $492,300 | $164,000 | $328,300 |
| 2016 | $4,923 | $484,500 | $164,000 | $320,500 |
| 2015 | $4,729 | $469,600 | $149,100 | $320,500 |
Source: Public Records
Map
Nearby Homes
- 19 Oak Bluff Rd
- 29 Sheppard Rd
- 20 Brady Rd
- 11 Village Green Dr Unit B
- 368 Old Plymouth Rd
- 5 Pocasset Rd
- 5 Oakwood Dr
- 10 Tecumseh Rd
- 0 State Rd
- 48 Menotomy Rd
- 133 Phillips Rd
- 15 Nonantum Rd
- 92 Cliffside Dr Unit hole 2
- 1 Kara's Way
- 53 White Cliff Dr
- 67 Phillips Rd
- 67 Phillips Rd
- 18 Ocean Pines Dr Unit A
- 16 Ocean Pines Dr Unit B
- 1150 Long Pond Rd