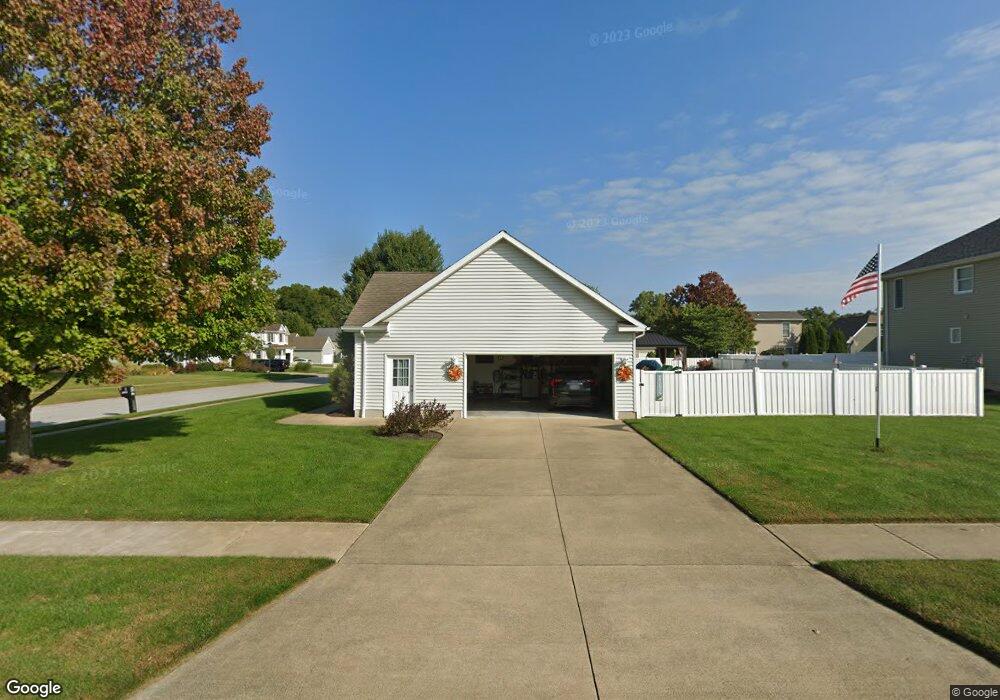
8 Katherine Way Norwalk, OH 44857
Estimated Value: $280,332 - $323,000
3
Beds
2
Baths
1,488
Sq Ft
$204/Sq Ft
Est. Value
About This Home
This home is located at 8 Katherine Way, Norwalk, OH 44857 and is currently estimated at $302,833, approximately $203 per square foot. 8 Katherine Way is a home located in Huron County with nearby schools including Maplehurst Elementary School, League Elementary School, and Pleasant Elementary School.
Ownership History
Date
Name
Owned For
Owner Type
Purchase Details
Closed on
Jun 14, 2022
Sold by
Frederick Michael A and Frederick Suzanne M
Bought by
Holeman Charles S and Holeman Teresa D
Current Estimated Value
Home Financials for this Owner
Home Financials are based on the most recent Mortgage that was taken out on this home.
Original Mortgage
$196,000
Outstanding Balance
$186,543
Interest Rate
5.3%
Estimated Equity
$116,290
Purchase Details
Closed on
Apr 12, 2021
Sold by
Funk Joy E
Bought by
Frederick Michael A and Frederick Suzanne M
Purchase Details
Closed on
May 29, 2014
Sold by
Funk Corwin R and Funk Joy E
Bought by
Funk Corwin R and Funk Joy E
Purchase Details
Closed on
Mar 18, 2003
Bought by
Funk Corwin R
Purchase Details
Closed on
Feb 20, 2003
Bought by
Funk Corwin R
Purchase Details
Closed on
Jul 12, 2000
Sold by
Maple City Ice Co
Bought by
Ross Sandra E
Home Financials for this Owner
Home Financials are based on the most recent Mortgage that was taken out on this home.
Original Mortgage
$129,820
Interest Rate
8.55%
Mortgage Type
New Conventional
Create a Home Valuation Report for This Property
The Home Valuation Report is an in-depth analysis detailing your home's value as well as a comparison with similar homes in the area
Home Values in the Area
Average Home Value in this Area
Purchase History
| Date | Buyer | Sale Price | Title Company |
|---|---|---|---|
| Holeman Charles S | $245,000 | -- | |
| Frederick Michael A | $95,000 | 1St American | |
| Funk Corwin R | -- | Attorney | |
| Funk Corwin R | -- | -- | |
| Funk Corwin R | $169,900 | -- | |
| Relocation Sirva | $169,900 | -- | |
| Ross Sandra E | $162,275 | -- |
Source: Public Records
Mortgage History
| Date | Status | Borrower | Loan Amount |
|---|---|---|---|
| Open | Holeman Charles S | $196,000 | |
| Previous Owner | Ross Sandra E | $129,820 |
Source: Public Records
Tax History Compared to Growth
Tax History
| Year | Tax Paid | Tax Assessment Tax Assessment Total Assessment is a certain percentage of the fair market value that is determined by local assessors to be the total taxable value of land and additions on the property. | Land | Improvement |
|---|---|---|---|---|
| 2024 | $3,294 | $80,320 | $14,400 | $65,920 |
| 2023 | $3,294 | $65,330 | $9,250 | $56,080 |
| 2022 | $2,638 | $65,330 | $9,250 | $56,080 |
| 2021 | $2,290 | $65,330 | $9,250 | $56,080 |
| 2020 | $2,050 | $56,840 | $7,680 | $49,160 |
| 2019 | $2,002 | $56,840 | $7,680 | $49,160 |
| 2018 | $1,966 | $56,840 | $7,680 | $49,160 |
| 2017 | $1,748 | $51,340 | $7,680 | $43,660 |
| 2016 | $1,725 | $51,340 | $7,680 | $43,660 |
| 2015 | $1,711 | $51,340 | $7,680 | $43,660 |
| 2014 | $1,911 | $56,010 | $7,390 | $48,620 |
| 2013 | $1,660 | $56,010 | $7,390 | $48,620 |
Source: Public Records
Map
Nearby Homes
- 17 Sara Dr
- 112 State Route 61 Unit 25
- 154 Gallup Ave
- 34 Old State Rd N
- 121 Leisure Ln
- 203 Spino St
- 4925 Old State Rd N
- 6 Blossom Dr Unit B
- 14 Republic St
- 173 Saint Marys St
- 0 Cleveland Rd
- 45 Grove Ave
- 14 Whitefield Blvd
- 32 Stower Ln
- 27 Whitefield Blvd
- 5054 State Route 601
- 520 Milan Ave Unit 154
- 520 Milan Ave
- 520 Milan Ave Unit 21
- 0 Milan Ave