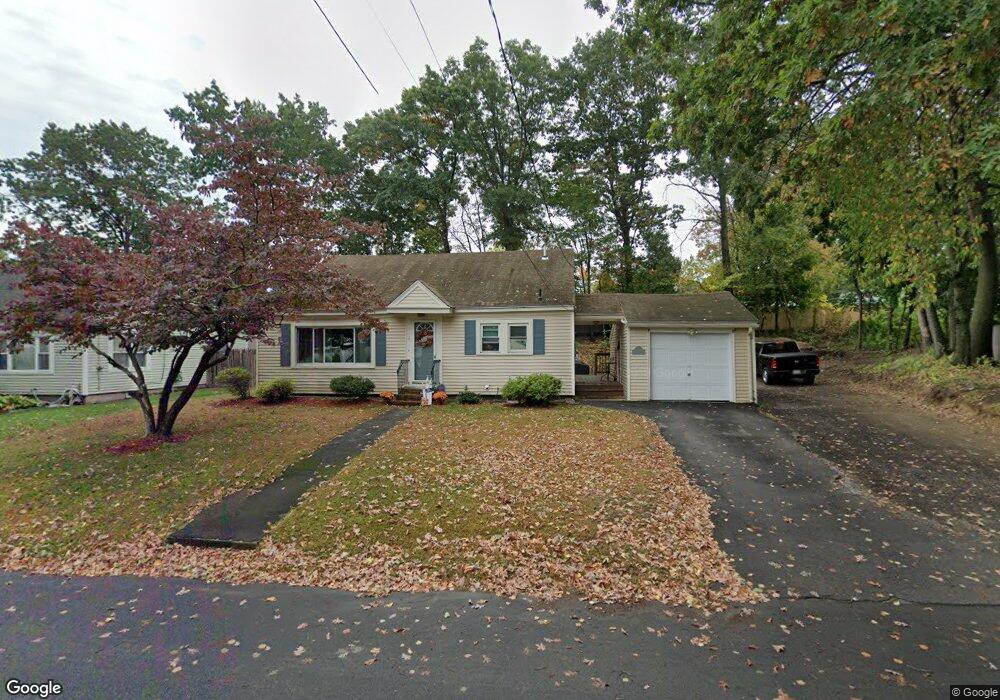
8 Kent St Lawrence, MA 01843
Colonial Heights NeighborhoodEstimated Value: $454,000 - $503,000
3
Beds
1
Bath
1,020
Sq Ft
$471/Sq Ft
Est. Value
About This Home
This home is located at 8 Kent St, Lawrence, MA 01843 and is currently estimated at $480,147, approximately $470 per square foot. 8 Kent St is a home located in Essex County with nearby schools including John Breen School, South Lawrence East Elementary School, and School For Exceptional Studies.
Ownership History
Date
Name
Owned For
Owner Type
Purchase Details
Closed on
Sep 30, 2013
Sold by
Torres Ana T and Cartagena Militza
Bought by
Torres Ana T
Current Estimated Value
Purchase Details
Closed on
Mar 23, 2007
Sold by
Vega Ana
Bought by
Vega Ana and Cartagena Militza
Home Financials for this Owner
Home Financials are based on the most recent Mortgage that was taken out on this home.
Original Mortgage
$253,300
Interest Rate
6.33%
Mortgage Type
Purchase Money Mortgage
Purchase Details
Closed on
May 17, 1999
Sold by
Halloran Daniel D
Bought by
Vega Ana
Home Financials for this Owner
Home Financials are based on the most recent Mortgage that was taken out on this home.
Original Mortgage
$115,900
Interest Rate
6.92%
Mortgage Type
Purchase Money Mortgage
Create a Home Valuation Report for This Property
The Home Valuation Report is an in-depth analysis detailing your home's value as well as a comparison with similar homes in the area
Home Values in the Area
Average Home Value in this Area
Purchase History
We collect this data history from publicly available records. To have your information removed, we recommend requesting removal directly through your county’s website.
| Date | Buyer | Sale Price | Title Company |
|---|---|---|---|
| Torres Ana T | -- | -- | |
| Vega Ana | -- | -- | |
| Vega Ana | $122,000 | -- |
Source: Public Records
Mortgage History
We collect this data history from publicly available records. To have your information removed, we recommend requesting removal directly through your county’s website.
| Date | Status | Borrower | Loan Amount |
|---|---|---|---|
| Previous Owner | Vega Ana | $253,300 | |
| Previous Owner | Vega Ana | $175,000 | |
| Previous Owner | Vega Ana | $115,900 | |
| Previous Owner | Vega Ana | $17,682 |
Source: Public Records
Tax History
| Year | Tax Paid | Tax Assessment Tax Assessment Total Assessment is a certain percentage of the fair market value that is determined by local assessors to be the total taxable value of land and additions on the property. | Land | Improvement |
|---|---|---|---|---|
| 2025 | $3,825 | $434,700 | $160,800 | $273,900 |
| 2024 | $3,611 | $390,400 | $140,900 | $249,500 |
| 2023 | $3,799 | $373,900 | $140,900 | $233,000 |
| 2022 | $3,764 | $329,000 | $125,600 | $203,400 |
| 2021 | $3,508 | $285,900 | $121,400 | $164,500 |
| 2020 | $3,339 | $268,600 | $104,100 | $164,500 |
| 2019 | $3,531 | $258,100 | $107,900 | $150,200 |
| 2018 | $3,341 | $233,300 | $106,000 | $127,300 |
| 2017 | $3,283 | $214,000 | $103,000 | $111,000 |
| 2016 | $2,916 | $188,000 | $73,600 | $114,400 |
| 2015 | $2,694 | $178,200 | $63,800 | $114,400 |
Source: Public Records
Map
Nearby Homes
- 5 Lafayette Ave
- 401 S Broadway
- 17 Gorham St
- 33 Garfield St
- 139-141 Foster St
- 437 N Main St Unit C
- 199-205 Boxford St
- 8 Brookfield St
- 25 Margate Rd
- 350 Greene St Unit 102
- 350 Greene St Unit 306
- 14 Tyler St Unit 1
- 132-134 S Broadway
- 246 Salem St
- 82 S Broadway
- 86 S Broadway
- 42 York St
- 361-363 N Main St
- 15-17 Stirling St
- 725 Waverly Rd
Your Personal Tour Guide
Ask me questions while you tour the home.