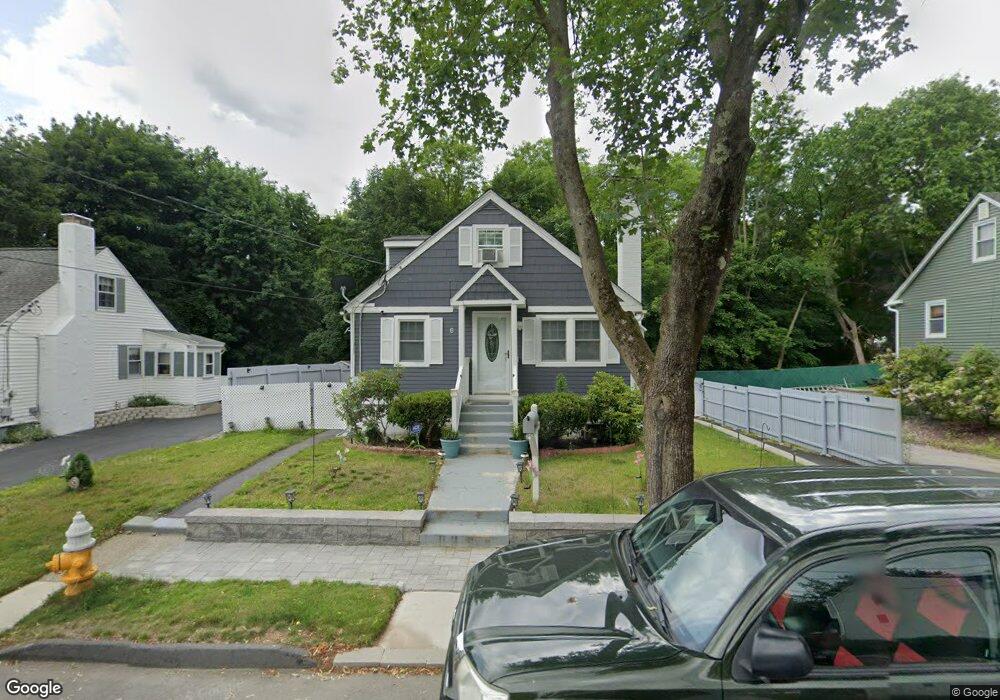
8 Knight St Worcester, MA 01605
Estimated Value: $344,285 - $378,000
3
Beds
1
Bath
900
Sq Ft
$408/Sq Ft
Est. Value
About This Home
This home is located at 8 Knight St, Worcester, MA 01605 and is currently estimated at $366,821, approximately $407 per square foot. 8 Knight St is a home located in Worcester County with nearby schools including Jacob Hiatt Magnet School, Chandler Magnet, and Lincoln Street School.
Ownership History
Date
Name
Owned For
Owner Type
Purchase Details
Closed on
Jul 3, 2019
Sold by
Butcher Robert T and Butcher Caroline N
Bought by
Espinoza Carlos A
Current Estimated Value
Home Financials for this Owner
Home Financials are based on the most recent Mortgage that was taken out on this home.
Original Mortgage
$207,500
Outstanding Balance
$181,789
Interest Rate
3.82%
Mortgage Type
New Conventional
Estimated Equity
$185,032
Purchase Details
Closed on
Feb 27, 2006
Sold by
Est Taris Anna D and Taris Thomas E
Bought by
Butcher Caroline N and Butcher Robert T
Home Financials for this Owner
Home Financials are based on the most recent Mortgage that was taken out on this home.
Original Mortgage
$130,000
Interest Rate
6.17%
Mortgage Type
Purchase Money Mortgage
Create a Home Valuation Report for This Property
The Home Valuation Report is an in-depth analysis detailing your home's value as well as a comparison with similar homes in the area
Purchase History
| Date | Buyer | Sale Price | Title Company |
|---|---|---|---|
| Espinoza Carlos A | $222,500 | -- | |
| Butcher Caroline N | $162,500 | -- |
Source: Public Records
Mortgage History
| Date | Status | Borrower | Loan Amount |
|---|---|---|---|
| Open | Espinoza Carlos A | $207,500 | |
| Previous Owner | Butcher Caroline N | $130,000 |
Source: Public Records
Tax History
| Year | Tax Paid | Tax Assessment Tax Assessment Total Assessment is a certain percentage of the fair market value that is determined by local assessors to be the total taxable value of land and additions on the property. | Land | Improvement |
|---|---|---|---|---|
| 2025 | $4,081 | $309,400 | $107,900 | $201,500 |
| 2024 | $4,022 | $292,500 | $107,900 | $184,600 |
| 2023 | $3,849 | $268,400 | $93,800 | $174,600 |
| 2022 | $3,526 | $231,800 | $75,100 | $156,700 |
| 2021 | $3,264 | $200,500 | $60,100 | $140,400 |
| 2020 | $3,203 | $188,400 | $60,100 | $128,300 |
| 2019 | $3,056 | $169,800 | $54,000 | $115,800 |
| 2018 | $3,080 | $162,900 | $54,000 | $108,900 |
| 2017 | $2,920 | $151,900 | $54,000 | $97,900 |
| 2016 | $2,861 | $138,800 | $40,900 | $97,900 |
| 2015 | $2,786 | $138,800 | $40,900 | $97,900 |
| 2014 | $2,712 | $138,800 | $40,900 | $97,900 |
Source: Public Records
Map
Nearby Homes
- 655 Plantation St Unit 20B
- 22 Huron Ave
- 39 Bullard Ave
- 79 Humes Ave
- 2 Teconnett Path
- 340 Lake Ave N
- 17 Goucher Ave
- 2101 Halcyon Dr Unit 2101
- 3205 Halcyon Dr Unit 3205
- 91-93 Natural History Dr
- 110 Beverly Rd
- 64 Wauwinet Rd
- 248 Saint Nicholas Ave
- 58 Osceola Ave
- 29 Dominion Rd
- 7 Eaglehead Terrace Unit 6
- 2 Selden St
- 30 Melrose St
- 5 Wakefield St
- 40 Phillips Ave
Your Personal Tour Guide
Ask me questions while you tour the home.